Today 10/27/21 was the first significant down day for the S&P 500 (SPX) since the rally began on 10/13/21. Assuming the rally is complete the combination of Point & Figure charting and Fibonacci retracement analysis is an effective method to discover potential support levels.
Point & Figure charts consist of columns of X’s and O’s that represent filtered price movements. X-Columns represent rising prices and O-Columns represent falling prices. Each price box represents a specific value that price must reach to warrant an “X” or an “O.” Time is not a factor in P&F charting; these charts evolve as prices move. No movement in price means no change in the P&F chart.
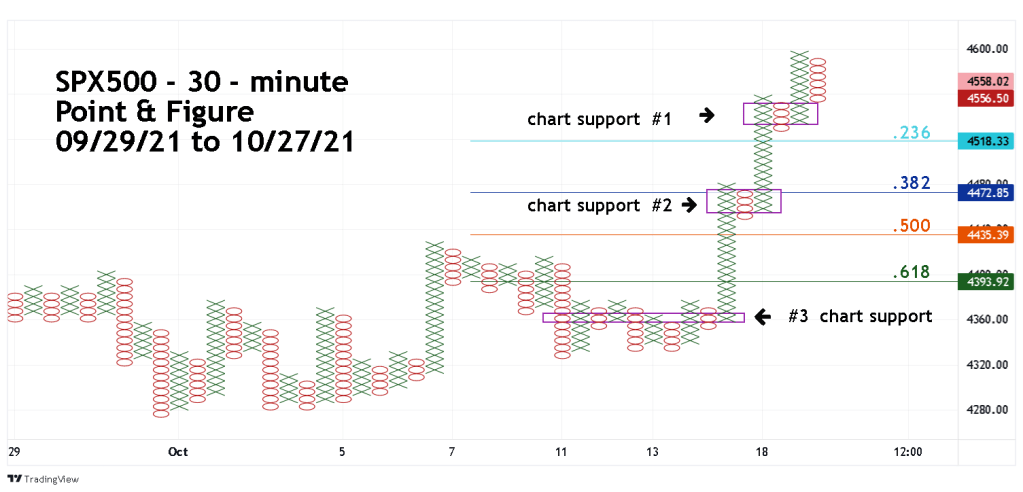
The SPX500 – 30-minute Point & Figure (PF) chart courtesy of Trading View illustrates near-term potential support levels.
SPX500 is a stock index on the Trading View website. The index follows the activity of the S&P 500 futures contracts and is priced similar to the SPX. Because SPX500 tracks action outside of the SPX trading hours it reveals potential support/resistance levels beyond the time the SPX is trading.
To find support levels on PF charts go down the most recent column of “X’s” until you find an “X” with adjacent columns to the left, this is illustrated as chart support #1. This potential support has three columns and two rows. Note that the low today stopped at the upper level of the support zone, so a bottom could have been made at todays low. If on 10/28/21 there’s more decline, the bottom of the second row could be the termination point for the drop.
Note that chart support # 1 is not at a Fibonacci support level. Chart support at a Fibonacci retracement level have a higher probability of stopping a decline.
Below chart support level # 1 is a .236 Fibonacci retrace of the rally from 10/04/21 to 10/26/21 which is not at a support level – therefore it’s a lower probability support level.
Chart support level # 2 is matched with the Fibonacci .382 retrace and makes this the most likely area for a bottom.
Fibonacci .500 retracements usually don’t provide support which opens the door for a drop down to the .618 level or chart support # 3.
The bearish seasonal time window is closing – note that the 2020 September to October SPX decline ended on the last trading day in October. If the current decline continues it may only last four or five trading days.
