In the prior two trading days the NYSE Composite (NYA) has blasted up to near its all-time high made on 09/02/21.
The daily NYA chart courtesy of Trading View illustrates its recent action.
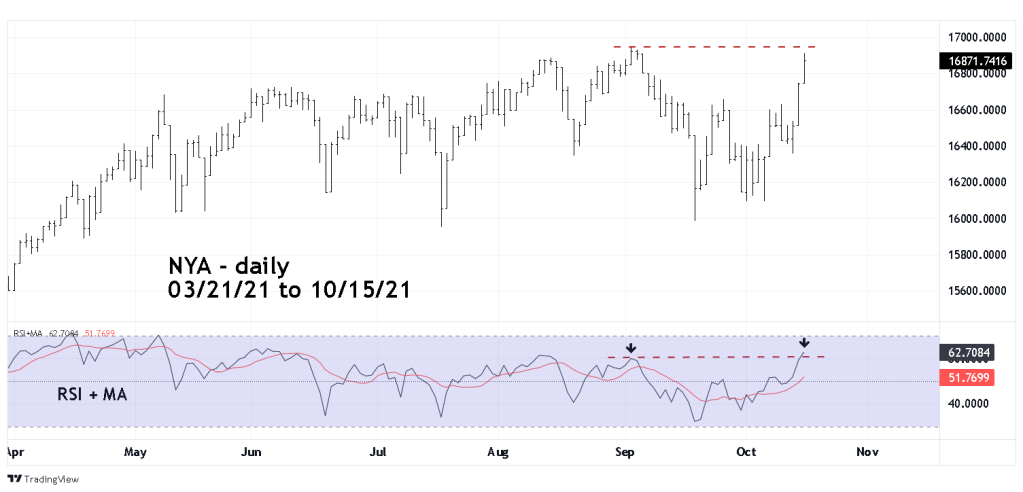
Note the RSI is now above the level recorded at 09/02/21, this is a bullish divergence and implies the bull trend could continue. Also note RSI has still not reached the overbought zone which begins at 70%. The ideal daily RSI condition for at least an intermediate bearish signal would be having at least one bearish divergence within the overbought zone. If this signal were to happen it would probably take several weeks to develop.
The daily NYSE – Advance/Decline line ($NYAD) courtesy of StockCharts.com confirms the bullish action.

The bearish season for US stocks continues into late October and sometimes it can go into early November. In 2020 US stocks made a double bottom. The first bottom was in late September the second slightly higher bottom occurred on the last trading day for October. Perhaps another double bottom could happen in 2021, with the first bottom in early October and the second bottom in late October.
