The “S&P 500 Near Important Support 10-14-21” blog noted the S&P 500 (SPX) was near overhead and Fibonacci resistance in the SPX 4440 to 4465 area. Subsequently the SPX pushed above the resistance and has now reached the final resistance zone of the 09/02/21 to 10/04/21 decline.
Trading View has an index called SPX500 which tracks the progress of the S&P 500 futures during all trading hours. SPX500 is priced very closely to the SPX which makes it a good index to make comparisons between cash – SPX and the S&P 500 futures.
The 60 – minute SPX500 – Point & Figure chart courtesy of Trading View illustrates resistance and support zones.
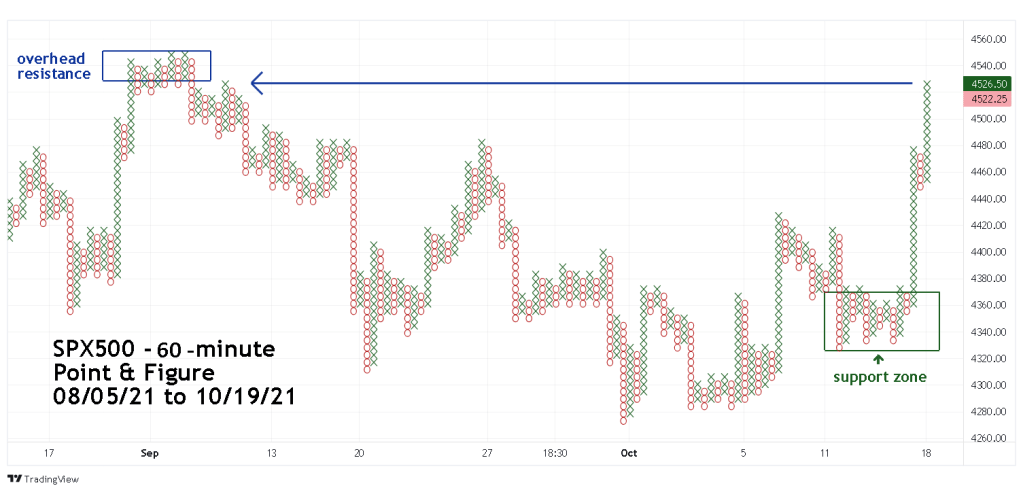
Point & Figure charts are a great tool to discover support/resistance. Today, 10/19/21 SPX500 rallied to just below the overhead resistance zone. Also note SPX500 reached the same level of a short-term peak made on 09/09/21.
Note the rally over the last few trading days has been steep with only a small correction zone in the middle. If the overhead resistance stops the rally its possible the next decline could be steep, reaching the support zone in a few trading days.
The 60- minute SPX chart illustrates the action since 08/27/21.

The SPX high on 10/19/21 had a bearish RSI divergence in the overbought zone, this implies a decline could begin soon. Additionally, 10/20/21 is a full moon, occasionally full/new moons can signal market bottoms/tops.
There’s a chance for a short-term trade lasting from three to eight trading days.
Short 50% non-leveraged SPX related funds at the open of the SPX trading session on 10/20/21. Place a stop loss of half the position on a move above SPX 4560.00 Place a stop on the other half of the position on a move above SPX 4580.00 Do not short if the SPX opens 10/20/21 above 4560.00.
