The 10/14/21 blog noted that the S&P 500 (SPX) was near an important resistance zone that went up to SPX 4465.40. On 10/15/21 the SPX punched through this resistance zone which opens the door for a move up to at least the all-time high made on 09/02/21.
The daily SPX chart courtesy of Trading View updates the long-term Elliott wave count.
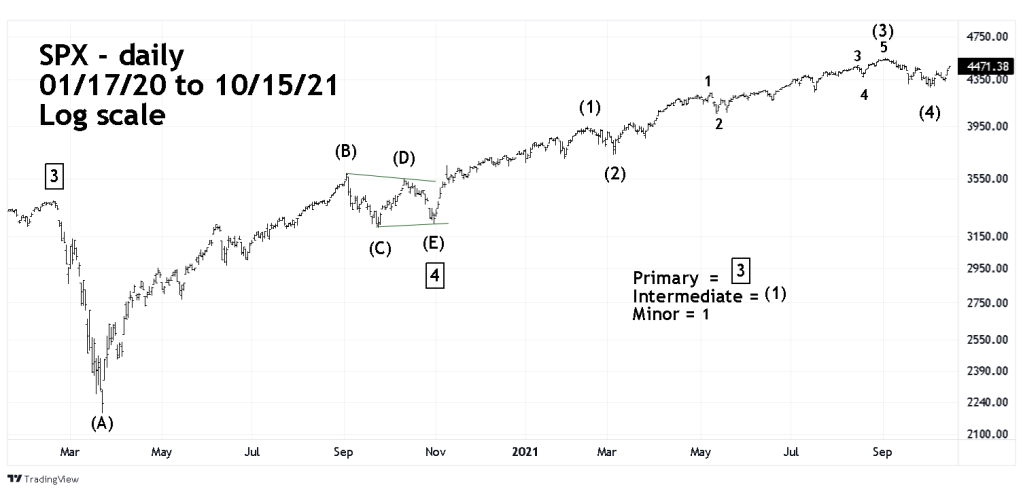
Within Elliott motive waves there’s usually a Fibonacci relationship between sub-waves “two” and “four”, the most common relationship is equality.
The supposed Intermediate wave (2) – the February to March 2021 decline was 227.09 points. The September to October 2021 drop was 226.91 points, almost exactly equal. The February to March drop was 5.74% the September to October decline was 5.00%.
A close examination of the February to March correction reveals considerable choppiness and the decline appears to be an Elliott wave Double Zigzag. The 10/06/21 post “Three Possible Elliott Wave Counts” illustrated that the 09/02/21 to 10/04/21 drop could be counted as a Double Zigzag. Within Elliott wave guidelines for alternation wave “two’s” and “four’s” almost always have different corrective patterns. With both Intermediate waves (2) and (4) counting as Double Zigzags it implies that Intermediate wave (4) is still under construction, with the September to October drop as just the first part of the developing correction.
The 60 – minute SPX chart illustrates a possible path that could happen over the next few weeks.

Since the supposed Intermediate wave (2) was in the Zigzag family of corrections, the supposed Intermediate wave (4) could be in the “Flat” or Horizontal Triangle” families.
Horizontal Triangles are common in wave “four’s” and the most likely path the SPX could be following.
Note – for the sake of clarity this chart illustrates the 09/02/21 decline as a Single Zigzag pattern. Please see the first chart of the 10/06/21 blog for the details of the Double Zigzag pattern.
If the rally from 10/04/21 is complete or near complete, the next decline could continue into late October or early November.
On 10/15/21 traders were stopped out of a 75% short position initiated on 10/09/21 and 10/10/21 the profit was 0.30%. There could be an opportunity to establish long positions if the SPX declines into a support zone – late October to early November 2021.
