The S&P 500 (SPX) rally on 08/27/21 pushed beyond the leeway of major Fibonacci resistance at SPX 4437.63. This potential resistance level was first discussed in the 07/05/21 blog “The Next S&P 500 Resistance Level”. This Fibonacci point was derived by taking the growth rate of the March 2009 to April 2010 rally – presumed Primary wave “1” of 82.9% multiplied by 1.236 equaling a growth rate of 102.46%. This growth rate when added to the presumed Primary wave “4” bottom made in March 2020 at 2191.86 targeted SPX 4437.63. A wide leeway zone was given because the original Fibonacci coordinates are from a much lower area made more than ten years ago.
SPX 4702.86 could be a major Fibonacci resistance level. This level is derived by multiplying the Primary wave “1” growth rate of 82.9 by 1.382 yielding a growth rate of 114.56% added to SPX 2191.86 targets 4702.86.
There could be a corrective decline before this target is reached. As noted for the last several weeks internal momentum of the US stock market has deteriorated dramatically. Additionally seasonal patterns are bearish from September to October. Previous blogs noted a decline of 12 to 15% could be imminent. Perhaps a near -term drop could be in the area of 8 to 10%.
The weekly SPX chart courtesy of Trading View illustrates a possible course the SPX could take in the coming months.

Assuming there’s a near-term SPX peak, the next decline could bottom somewhere in the area of 4160 to 4060 during September or October. If the bottom holds the next rally could reach 3700 by late 2021 or early 2022. Sometimes US stocks have significant turns at the cusp of a new year. The last time this happened was late December 2018.
There’s another possible Fibonacci resistance level at SPX 4595.18. This target is calculated by taking the distance of the SPX February to March 2020 crash of 1201.66 points multiplied by 2 which equals 2403.32 added to the crash bottom at 2191.86 targets SPX 4595.18.
Near-term there’s a high probability that at least a multi-week decline could begin soon. The 08/14/21 blog “On the Verge of a Mini Crash” illustrated that the SPX could be forming an Elliott wave -Ending Diagonal Triangle (EDT)
The daily SPX chart shows that this pattern is still a possibility.
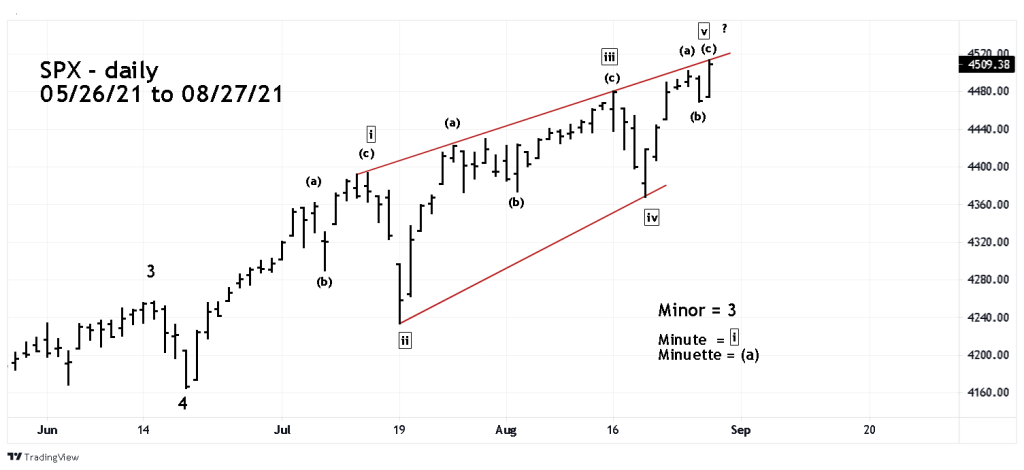
EDT’s are the only Elliott pattern in which motive waves “one, three, and five” sub dived into three waves. Note that Minute waves “I , iii, and v” are composed three waves. Fibonacci analysis supports this wave count. The suppose Minute wave “I” is 229.28 points times .618 equals 141.70 added to Minute wave “iv” at 4367.73 targets 4509.43. The high on 08/27/21 was 4513.33.
