During the last six years there have been two Fibonacci price extensions that have precisely forecasted important S&P 500 (SPX) tops. Perhaps a third Fibonacci price extension could soon forecast another SPX peak.
The weekly SPX chart courtesy of Trading View illustrates the 2015 top.
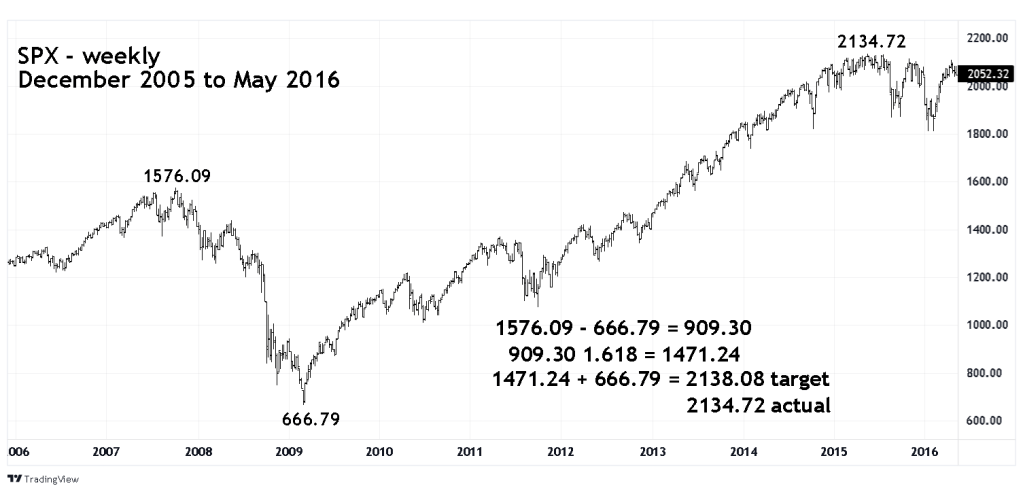
A 1.618 Fibonacci extension of the SPX 2007 to 2009 bear market came within 3.31 points of precisely forecasting the May 2015 peak. Subsequently there was a nine-month 15% bear move.
The monthly SPX chart shows the forecast for the February 2020 top.
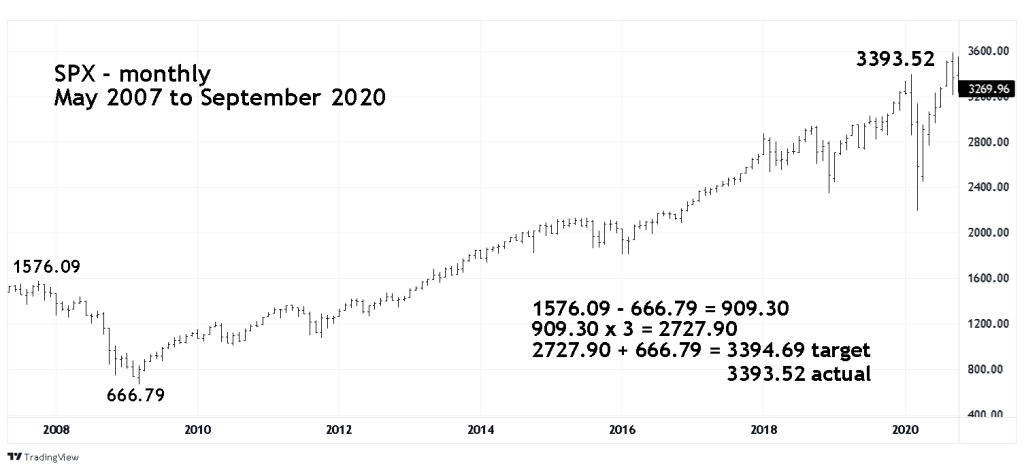
Multiplying the same 2007 to 2009 bear market by the Fibonacci number of 3 came withing 1.17 points of hitting the SPX peak in February 2020. What came after was a two-month 35% crash.
A 4.236 Fibonacci extension of the 2007 to 2009 bear market targets SPX 4518.58. The SPX high on 08/30/21 was 4537.36 which is only 18.78 points from the target. Considering the time and price distance from the original coordinates, 18.78 points is acceptable leeway.
Or perhaps if the SPX continues to rally there could be a higher target using different coordinates.
The weekly SPX chart from September 2019 illustrates a potentially higher target.
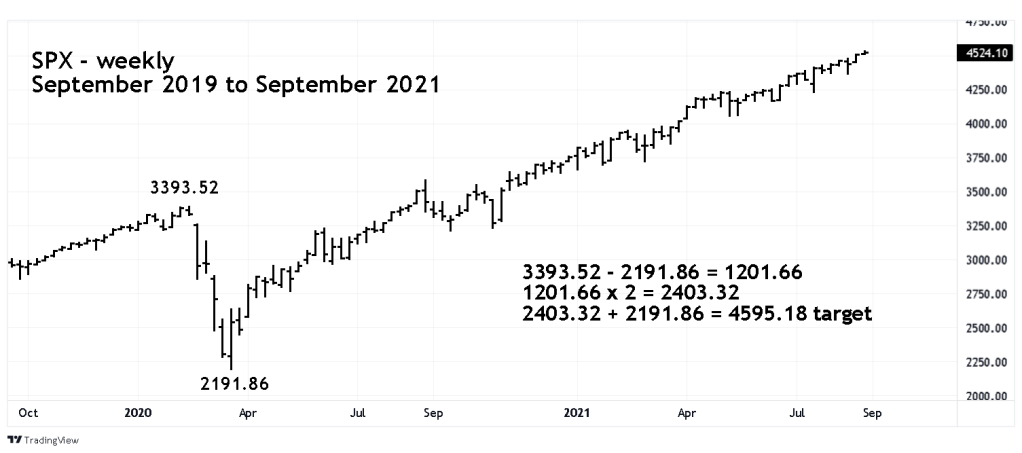
On 09/03/21 the US Nonfarm Payroll report will be released. Recent US economic reports have triggered rallies in US stocks. Perhaps the 09/03/21 report could push the SPX near the 4595.18 target.
