Today 8/27/21 both the S&P 500 (SPX) and Nasdaq Composite (IXIC) made new all-time highs.
The Daily NYSE – New 52 – Week Highs chart ($NYHGH) courtesy of StockCharts.com updates the activity of this indicator.
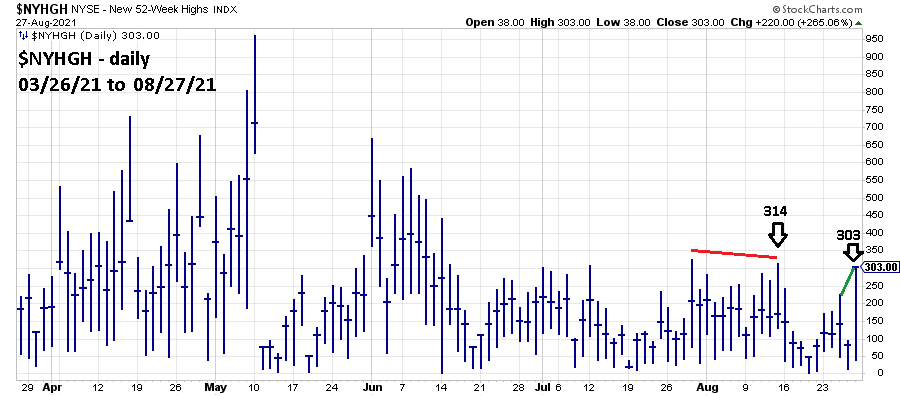
The move today above the level recorded on 08/25/21 is mildly bullish. If next week there’s a move above 314 new highs made on 08/13/21 it would be additional bullish evidence.
The daily Nasdaq Composite – New 52 – Week Highs chart ($NAHGH) updates this indicator.

Today on a move above SPX 4510.00 traders were stopped out of a 50% short position initiated at the SPX open on 07/12/21. The move up from the 07/12/21 open was 3.10% the loss on the 50% position was 1.55%.
The next blog will examine additional SPX upside targets.
