A follower to this blog asked if there was a Fibonacci resistance level for the Nasdaq Composite. The 07/05/21 blog “The next S and P 500 Resistance Level’’ measured the S&P 500 (SPX) growth from March 2009 to April 2010 with the SPX rally from March 2020. This examination showed that the rally from March 2020 had a Fibonacci ratio of 1.236 to the 2009 to 2010 rally at SPX 4437.64. Today 08/06/21 the SPX reached 4440.82.
The monthly Nasdaq Composite (IXIC) chart courtesy of Trading View illustrates the long-term Elliott wave count since 2009.
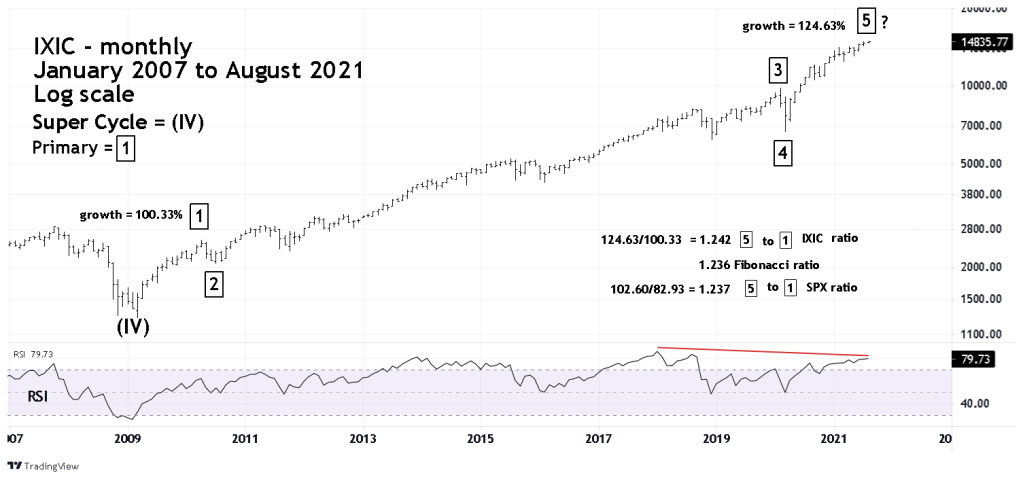
Using the same comparison as the SPX shows the growth rate of the supposed Primary wave “5” to Primary wave “1”. IXIC has so far is only slightly beyond a bulls eye – 1.236 Fibonacci ratio.
What’s amazing is that even though the growth rates of SPX Primary waves “1” and “5” are different from the IXIC Primary waves “1” and “5”, the ratios are close to each other and the target Fibonacci 1.236. This is evidence that the long-term wave counts for both indices could be correct. It implies the next bear market could last for years.

Thanks for your informative analysis. I’ve been following your postings from Trading View and
I noticed that it’s a very rare case for you to see this market from the point of bear market view.
In terms of the trend following strategy, predicting a market top could be wild trading strategy.
what do you think of possibilities about extending primary wave 5?
(in case of market could climbing further)
Thanks, Bong
LikeLike
My market analysis is based on the evidence. Since the beginning of 2021 the evidence for the US stock market has become increasingly bearish and has influenced my opinion. There have already been a few extensions within the supposed Primary wave “5” – which is the rally that began 03/23/20. An Elliott wave extension could happen in any market at any time. Unfortunately there’s no way to predict an extension. If a market breaks above/below an important Fibonacci support/resistance level its a clue an extension is underway. For the current S&P 500 situation, as of the high on 08/06/21 has reached a major Fibonacci resistance point at 4437. A move above S&P 500 – 4470.00 would be a clue an extension was underway. If so, the S&P 500 could be headed to the next higher Fibonacci resistance level. If there’s a move above 4470.00 I will discuss the next potential Fibonacci resistance levels in a future post.
LikeLike
thanks you so much for a reply
LikeLike
You’re welcome.
LikeLike