Today 08/05/21 the Nasdaq Composite made a new all-time high unaccompanied by the other two main US stock indices, S&P 500 (SPX) and Dow Jones Industrial Average. The SPX all-time high was at 4429.97 made on 07/29/21 , todays SPX high was 4429.55.
The daily chart of Nasdaq – New 52 – weeks highs ($NAHGH) courtesy of StockCharts.com illustrates the action of this indicator since the start of 2021.

Amazingly the downward trend continues.
The message from the NYSE – New 52 – week highs ($NYHGH) is the same.
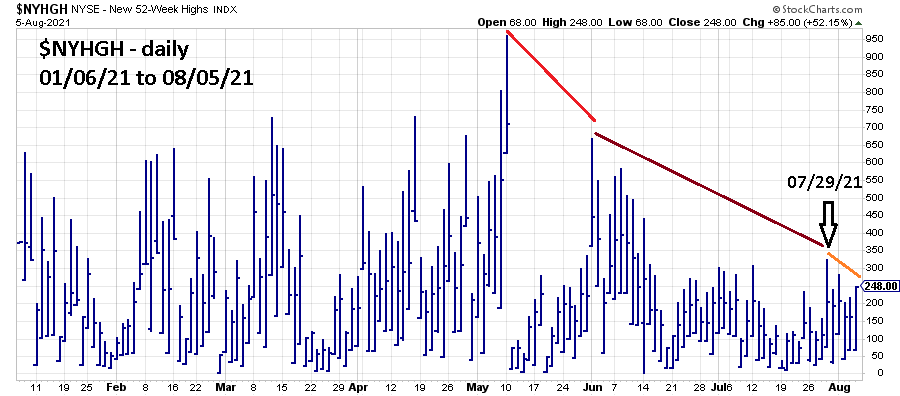
Very short term – the SPX all-time high on 07/29/21 was 4429.97, the closing SPX high that day was 4419.14 vs. todays close of 4429.04. The intraday $NYHGH new highs on 07/29/21 was 326, todays $NYHGH intraday high was 248. With a slightly higher closing SPX price, new 52 – week highs decreased.
SPX has major Fibonacci resistance in the area of 4437.00. Please see the 07/05/21 blog “The Next S&P 500 Resistance Level” and the 07/26/21 blog “Fibonacci Resistance Points” for a detailed explanation of this potential resistance zone.

“House Of Cards”
LikeLike
Thanks for the comment.
LikeLike