The 07/27/21 blogs, “Market Nexus Points” and “Market Nexus Points – Part Two” examined S&P 500 (SPX) nexus points using logarithmic scale. This blog examines a potential nexus point using arithmetic scale.
R.N Elliott stated that when using trend lines to aid in the discovery of wave patterns, its possible to use both logarithmic and arithmetic scale charts. The same concept can be used when comparing two sections of a wave movement.
The daily SPX chart courtesy of Trading View illustrates a potential nexus point projection using arithmetic scale.
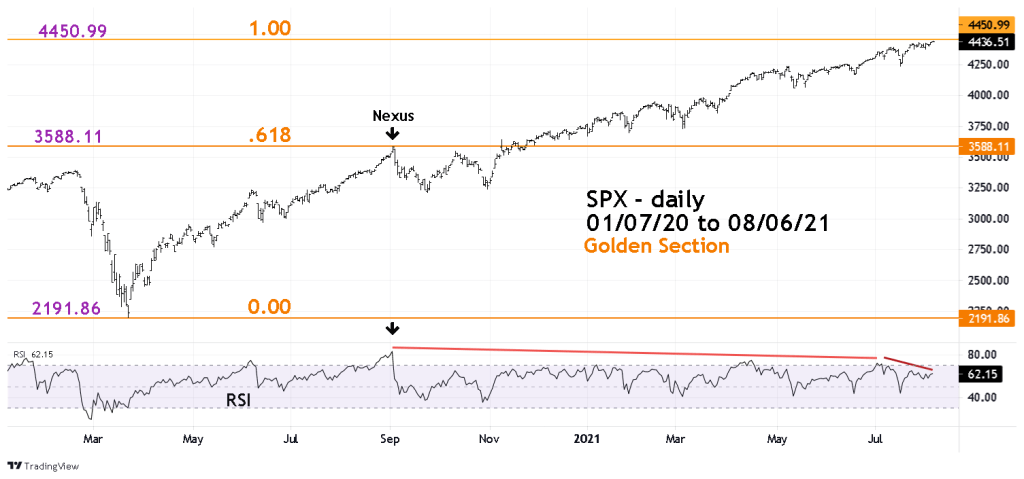
The SPX 09/02/20 peak is a potential nexus point because its just prior to the largest decline within the March 2020 to August 202 bull move. It also represents the point of maximum market momentum – note the RSI.
The price distance from the start of the rally on 03/23/20 to the 09/02/20 peak is 1396.25 points, multiplied by the Fibonacci ratio of .618 calculates to 862.88 points, added to the 09/02/20 peak at 3588.11 targets SPX 4450.99 as a potential top for the second section of the bull market. This is within leeway of the main Fibonacci resistance of 4437.64 illustrated in the 07/05/21 blog “The Next S&P 500 Resistance Level.
If the SPX makes a significant top near 4450.99 it would create what’s called a “Golden Section” with .618 of the price action below the 09/02/20 nexus point and .382 of the price action above the nexus point.
