Today 08/02/21 the Dow Jones Industrial Average (DJI) made a new all-time high unconfirmed by the other two main US stock indices – S&P 500 (SPX) and Nasdaq Composite. I refer to this situation as a “rule of the majority signal” in this case a bearish signal, the truth is with the two non – confirming indices. The final US stock market tops in 2000 and 2007 came with only one of the three main US stock indices making a new all-time high.
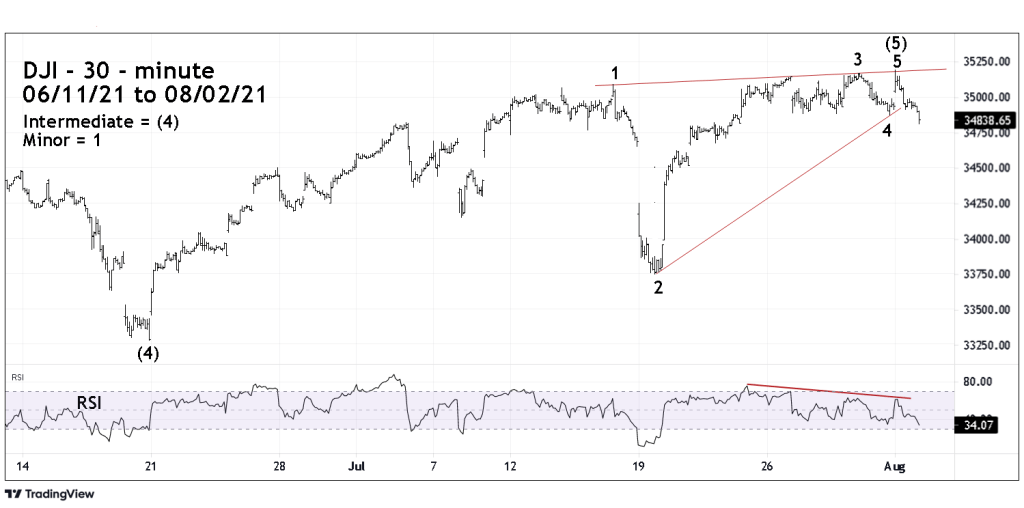
Today as the DJI made its new high it also appears to have completed an Elliott wave – Ending Diagonal Triangle. This is a termination pattern that appears only in the fifth wave position of Elliott motive waves and in the wave “C” Position of corrective waves.
The DJI completed the day below the 07/30/21 low and below the lows of every trading day during the week of 07/26/21 to 07/30/21.
The DJI 30-minute chart courtesy of Trading View illustrates the potential Ending Diagonal Triangle.
The recent SPX intraday Elliott wave count is unclear. A break below the SPX bottom of 4372.51 made on 07/27/21 could have very bearish implications.
