Full/New moons can occasionally signal turns in almost all markets. For stocks, new moons tend to signal tops. Full moons tend to signal bottoms. Lunar cycle signals appear more frequently when markets are in a multi-month sideway movements. Far fewer signals appear when markets are in steady up or down trends.
The daily S&P 500 (SPX) chart courtesy of Trading View illustrates the lunar cycles for 2021.
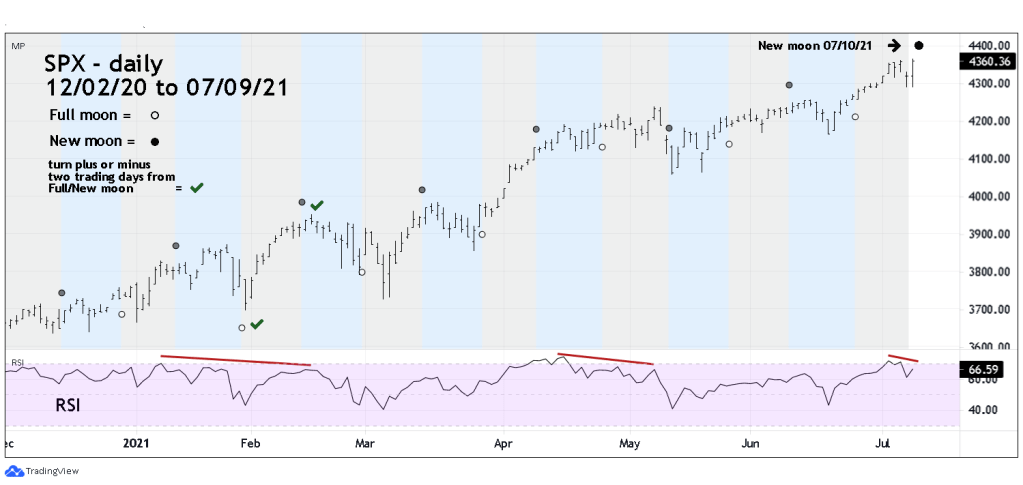
There have been only two effective lunar signals since the start of 2021. I use a leeway of plus or minus two trading days from a New/Full moon as the time frame for a potential turn. A case can be made that since the SPX is still in a steady uptrend it reduces the chance of a turn. However, the daily RSI has a bearish divergence. Note the RSI bearish divergence at the SPX February short-term peak.
There’s a New moon on Saturday- 07/10/21, with the SPX all-time high on 07/09/21 its possible at least a short-term decline could begin on 07/12/21. The turn time widow extends to 07/13/21 – the SPX could continue climbing into that date.
There are several other factors that suggest at least a short-term peak could be developing. These factors will be detailed in the next blog.
