Explanation of a Micro – Crash

I’m guessing to many, today’s opening micro crash in US stocks was a big surprise .  Those  observing the extremely bearish Nasdaq – Advance/Decline line and new 52 -week highs for the NYSE and Nasdaq Composite it could have been expected. 

The SPX 5-minute chart courtesy of Trading View illustrates a possible short-term Elliott wave count.

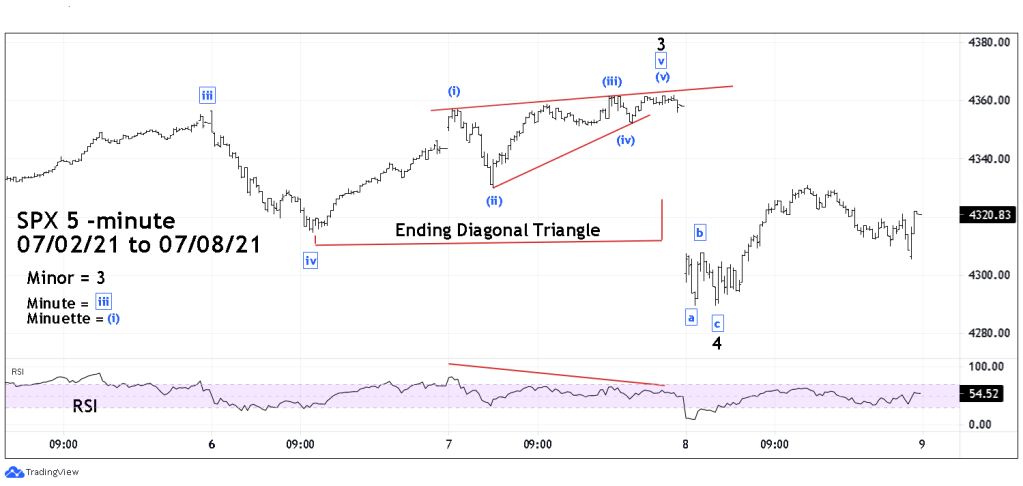
Under  this wave count the SPX could soon make another new all-time high.  

A  future blog will examine possible resistance and update the SPX daily Elliott wave count. 

Advertisement

Published by Mark Rivest

Independent investment advisor, trader, and writer. Articles have appeared on Technical Analysis of Stocks and Commodities , Traders.com Advantage, Futuresmag.com, and Finance Magnates.

Leave a Reply

Fill in your details below or click an icon to log in:

WordPress.com Logo

You are commenting using your WordPress.com account. Log Out /  Change )

Facebook photo

You are commenting using your Facebook account. Log Out /  Change )

Connecting to %s

%d bloggers like this: