As the S&P 500 (SPX) and Nasdaq Composite (IXIC) continue to climb, internal momentum indicators are becoming more bearish.
The 06/29/21 blog “Historical Perspective of Stock Market Momentum” illustrated the Bullish Percentage Index for the SPX ($BPSPX). The daily $BPSPX chart courtesy of StockCharts.com shows the activity as of 07/09/21.

On 07/08/21 $BPSPX made a new near-term low. The SPX rally on 07/09/21 has brought $BPSPX back to the bottom made on 06/21/21, a shocking near and longer-term bearish divergence.
For several years, the NYSE – Advance/Decline line has confirmed price action. Divergences are rare and small, spanning only a few days. What’s happened this year with the IXIC – Advanced/Decline line ($NAAD) is more traditional action.
The daily $NAAD chart illustrates the bearish divergence.

On 07/09/21 IXIC made a new all-time closing high yet $NAAD was significantly below the bearish divergence made at the June high.
The daily chart of NYSE New- 52 – Week Highs ($NYHGH) illustrates action up to 07/09/21.
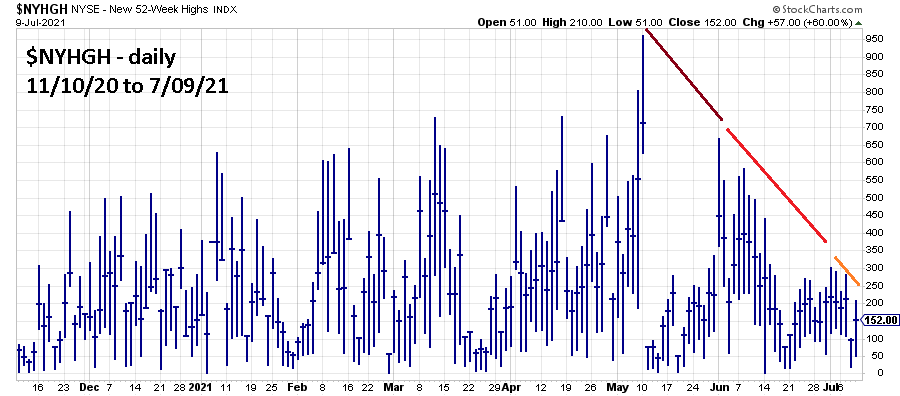
Another shocking bearish divergence. The next blog will focus on external momentum indicators

This is a “valuable internal information + bearish market perspective.
Notably,you often “see” things that other’s simply miss,
although it’s right there in front of their eyes as well.
Thank you
I look forward to each and every article published.
LikeLike
Thanks, I’m happy I can help.
LikeLike
That’s an interesting post. I am also considering the advance decline line when looking at the health of a stock market index. Do you think it makes a difference to view only ADV DECL for the members of an index or to view ADV DECL for the whole market (e.g. the NYSE)?
LikeLike
l look at the NYSE – A/D – $NYAD, SPX – A/D -$SPXADP, and Nasdaq Composite – A/D – $NAAD. The symbols are used on StockCharts.com you can get an A/D line by going to the cumulative setting. SPX and Nasdaq Composites mostly confirm price action, any bearish divergences have been rare and brief – only a few trading days. The Nasdaq A/D line which I’ve illustrated in my posts this year has given a more traditional bearish divergence signal – spanning several weeks. Mark
LikeLike
Thanks for providing your thoughts, Mark. I sometimes worry about too many small “hip” tech stocks distorting Nasdaq ADV/DECL data, but maybe that’s something which is not happening too often.
LikeLike