Within Elliott motive waves there’s usually a price and or time relationship between waves “one” and “five”. The most common relationship is the Fibonacci ratio of 1/1 – equality.
The monthly S&P 500 (SPX) chart courtesy of Trading View illustrates a presume Elliott five – wave motive pattern under development since March 2009.

When measuring movements with large percentage gains its best to compare the percentage growth of each motive sub waves. The supposed SPX Primary wave “1” boxed had a growth rate of 82.9%. Adding this growth rate to the supposed Primary wave “4” bottom on 03/23/20 targeted SPX 4008 as a possible top for Primary wave “5”. The SPX subsequently moved beyond this level, opening the door for potential resistance at the next higher Fibonacci ratio 1.1458 – targeting SPX 4274. This calculation was discussed in the 06/16/21 blog “Major S&P 500 Price and Time Targets – 06-16-21”. The SPX has moved beyond 4274.
The next higher Fibonacci ratio is 1.236.
The growth rate of Primary wave “1” of 82.9% x 1.236 = 102.46%
102.46% x the Primary wave “4” bottom of 2191.86 = 2245.78 points + 2191.86 = SPX 4437.64.
There’s a possible second Fibonacci coordinate within the supposed Primary wave “5” that’s close to 4437. Further wave action is needed before illustrating this second potential coordinate.
The daily Nasdaq Composite – Advance – Decline issues ($NAAD) illustrates what’s happening with this internal momentum indicator.
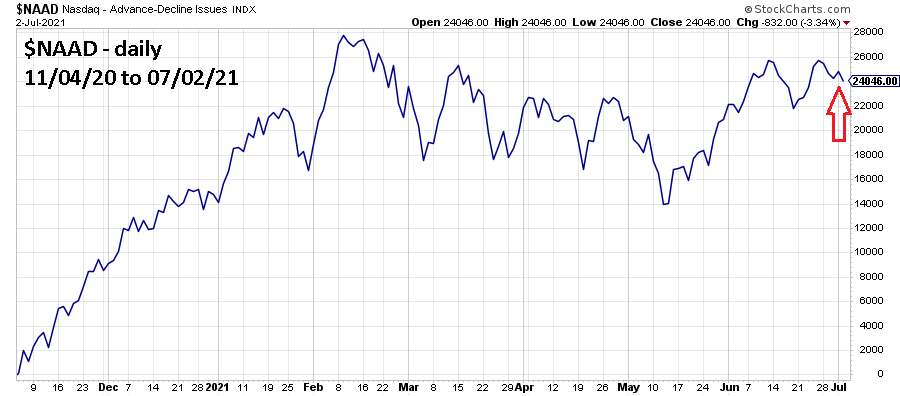
On 07/02/21 the SPX moved up 0.75%. The Nasdaq Composite (IXIC) climbed 0.81%. Both were fairly decent rallies. However, on 07/02/21 the NYSE had 41% stocks advancing vs. 55% stocks declining. The Nasdaq Composite was even more bearish with 31% stocks advancing vs. 65% stocks declining. These internal momentum readings are mind boggling! The IXIC has moved to a new all-time high while its Advance/Decline line continues to go down. Incredible!
On 07/02/21 both the SPX and IXIC made new all-time highs and is potentially bullish. The current internal momentum is mind boggling. In the coming days there could be more mind boggling.
