June 15,2021 could be an important date in the history of the US stock market. In the first minute of trading the S&P 500 (SPX) made a new all-time high then went down. Also, the daily VIX recorded a higher bottom vs. the SPX new high. As noted in several blogs this is a reliable signal for SPX tops. The VIX divergence is a subtle sentiment signal that traders are becoming more bearish.
The daily SPX – VIX chart courtesy of Trading View illustrates the subsequent action.
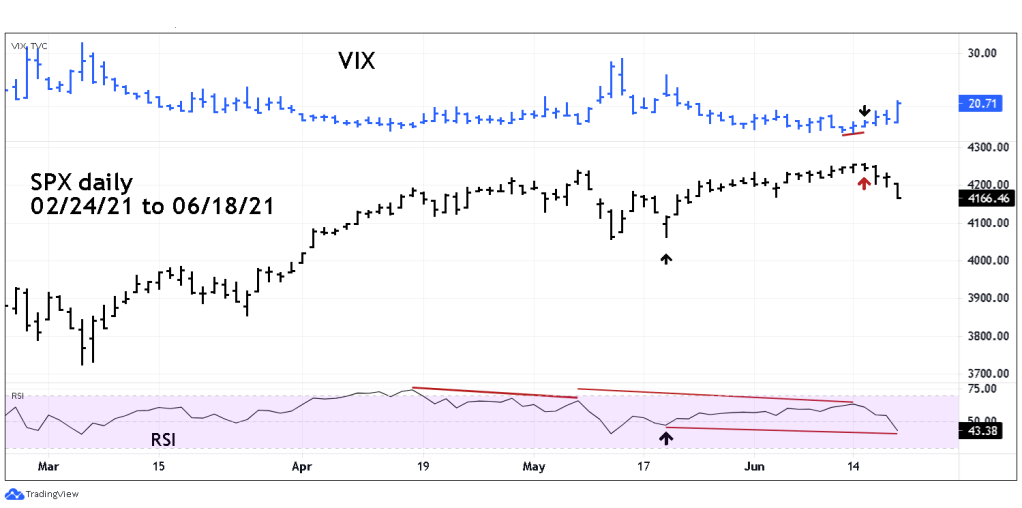
The SPX has been trending down since the bearish divergence.
The daily RSI also had a significant bearish momentum signal. Not only was there a double bearish divergence vs. the SPX 04/16/21 high, but the RSI level was bearishly alarming. On 06/14/21 the RSI reading was only 63% and indicates very weak upside momentum.
Additionally, on 06/18/21 daily RSI closed below the reading it made at the SPX 05/19/21 bottom. This indicates the SPX could soon be trading below the 05/19/21 bottom of 4061.
Trader short 100% non-leveraged SPX related funds on the open of the SPX 06/21/21 trading session. Use a move above SPX 4290.00 as a stop loss for 50% of the position. Use a move above SPX 4310.00 as a stop loss on the remaining 50%.
The next blog will summarize the long and short-term bearish evidence for US stocks.
