The 06/15/21 blog “ Revised daily S&P 500 Elliott Wave Count – 06/15/21 speculated that an Elliott wave – Ending Diagonal Triangle (EDT) was under construction from the S&P 500 (SPX) 05/12/21 bottom. Today 06/18/21 the SPX went below what counts as the EDT -Minor wave “2”. The post 06/15/21 decline was a supposed wave “four” and under Elliott wave rules wave “four” can never exceed the termination point of wave “two”. Therefore, something else is developing.
The 30-minute SPX chart courtesy of Trading View illustrates the most likely Elliott wave count.
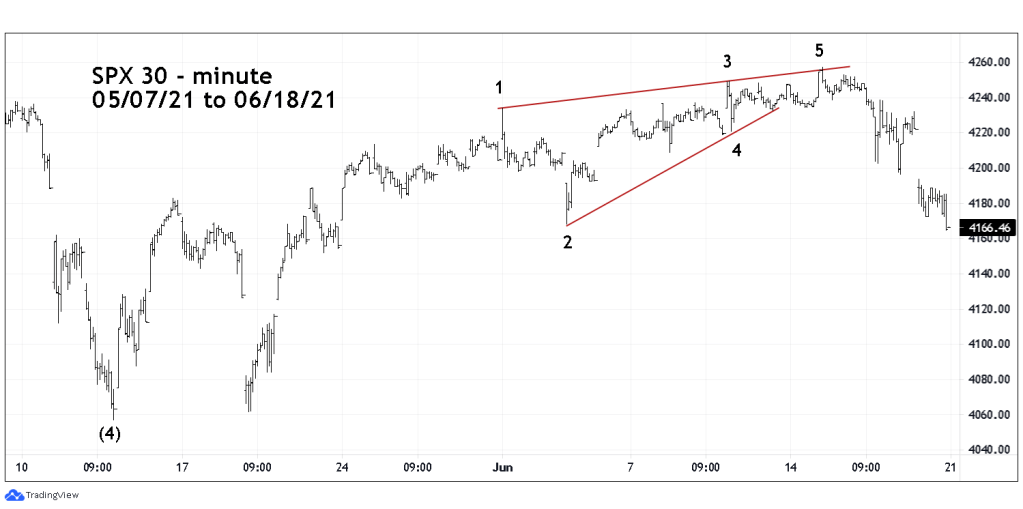
It appears the EDT up from the 05/12/21 bottom is probably complete as of 06/15/21 peak.
An alternate wave count – has a larger EDT from the 05/12/21 bottom is forming. If so the drop from 06/15/21 could be a developing wave “two”.
Another alternate count is that a Horizontal Triangle is forming from the SPX 04/29/21 top. The 05/12/21 bottom could be wave “A”, the 06/15/21 peak could be wave “B”, and wave “C” could be underway.
Momentum and Sentiment evidence argues strongly against these alternate counts. This evidence will be illustrated in the next blog.
