The 05/11/21 blog “S and P 500 – Detailed Elliott Wave Count – 05-11-21” noted that the Dow Jones Industrial Average (DJI) – Primary wave “1” rally from March 2009 to April 2010 equaled the time of the supposed Primary wave “5” rally March 2020 to May 2021. There’s also a price relationship as Primary wave “5” is related to Primary wave “1” by the Fibonacci ratio of 1.236. So far, the DJI 05/10/21 top has held and represents what could be a major turning point.
In several blogs I noted that the S&P 500 (SPX) post March 2020 rally could equal the growth of 2009 to 2010 rally. The strength of the SPX April 2021 move up exceeded that potential Fibonacci relationship. However, the SPX may already have reached the next Fibonacci relationship.
The most common Fibonacci ratio – called the Golden Ratio is .618.
The next most common relationship is .382 (.618 x .618 = .382.).
Below that is .236 (.382 x .618 = .236).
The next relationship is .1458 (.236 x .618 = .1458) which is rare but could be a factor in long and intermediate – term forecasting.
The monthly SPX chart courtesy of Trading View illustrates the long-term Fibonacci price relationship.
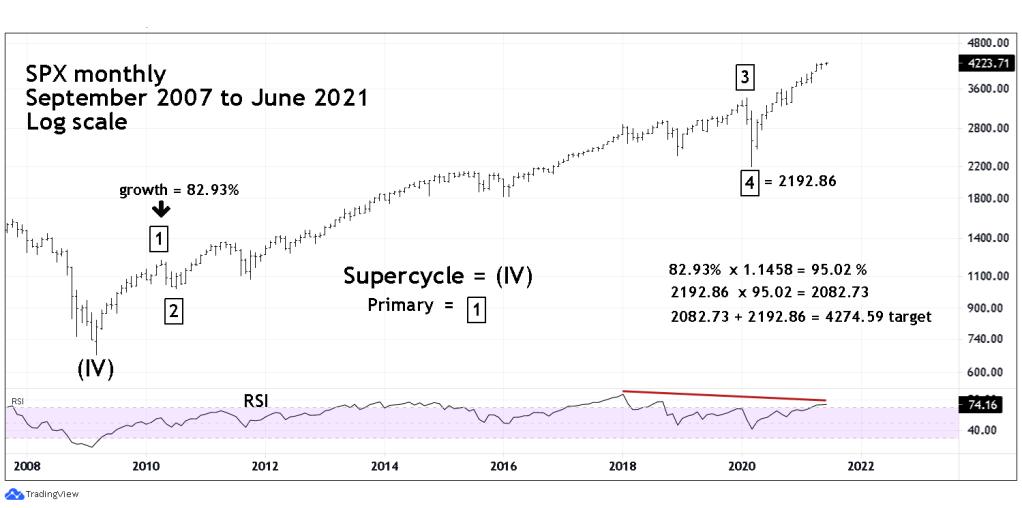
The SPX is close to a 1.1458 price relationship with Primary wave “1”, the recent high at 4257 is within leeway of this potential major resistance point, so a major peak could already be in place.
A time relationship of 1.1458 implies that the SPX could rally into July 2021. If this scenario plays out it will be discussed in a later blog.
The weekly SPX chart shows another potential long-term Fibonacci relationship.
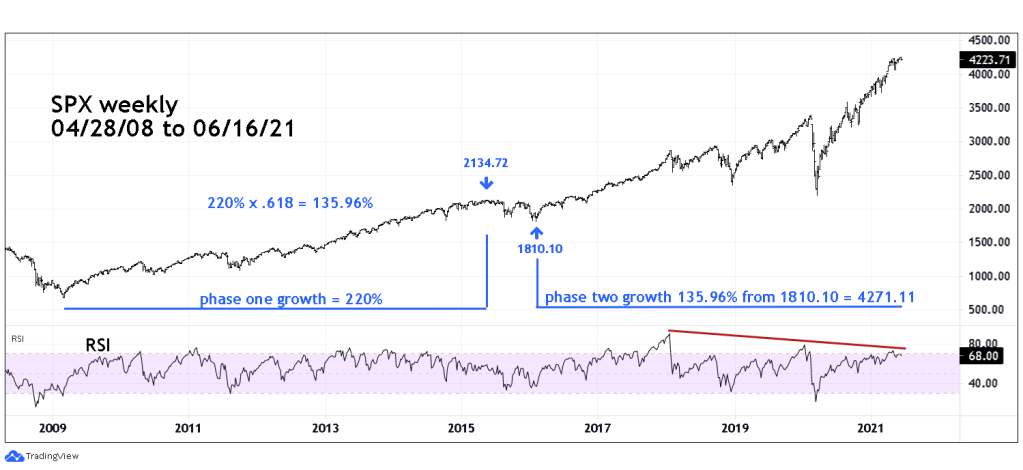
Robert Prechter’s book “Beautiful Pictures” noted that the secular DJI 1932 to 2000 bull market could be divided into two parts. That same concept could be taking place with the SPX 2009 to 2021 bull move.
The SPX 2015 high is near the mid-point in time. The growth rate of the first phase could have a Fibonacci relationship with the second phase. If the May 2015 top is the exact time- middle of the 2009 to 2021 movement it projects a potential top in July 2021.
The daily SPX chart looks at the intermediate-term view.

Intermediate wave (1) has potential price and time relationships with the supposed Intermediate wave (5).
Wave “four” of the supposed Ending Diagonal Triangle discussed in the 06/15/21 blog may have completed today 06/16/21. If the SPX can make another all-time within the next few trading days, it could mark an important top.
