The daily S&P 500 (SPX) chart courtesy of Trading View illustrates the updated daily Elliott wave count since the bull run that began on 03/23/20.
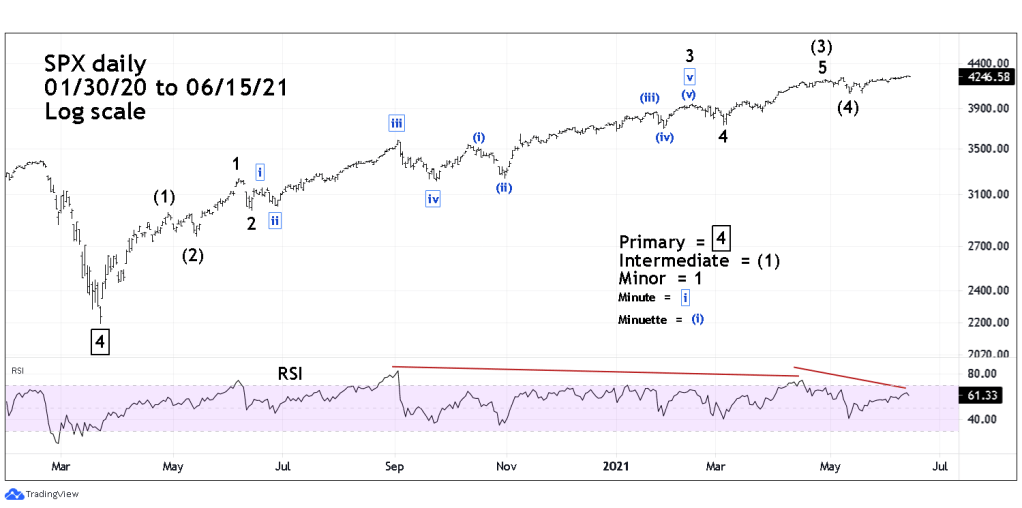
The log scale and daily RSI shows the weakness of the supposed Intermediate wave (5). Price is struggling to rise and appears to be near the point of collapse. Note the current wide double bearish RSI divergence. It’s possible a triple bearish divergence could soon develop.
The 30- minute SPX chart zooms in on recent price action.

Intermediate wave (4) appears to be an Elliott wave – Expanding Flat correction. In this pattern wave “a” subdivides into three waves. Wave “b” subdivides into three waves and marginally exceeds the point of origin of wave “a”. The final wave “c” subdivides into a five-wave motive pattern that exceeds the termination point of wave “a”.
The subsequent rally after Intermediate wave (4) appears to be a developing Elliott wave – Ending Diagonal Triangle (EDT). The third wave of this structure may have completed at today’s 06/15/21 opening high. Note that Minute wave “b” -boxed – of Minor wave “3” appears to be a nine – wave Horizontal Triangle.
The supposed EDT could complete on 06/18/21 or 06/21/21. The next blog will elaborate on the methodologies used to derive these dates and a price target for the EDT peak.
