The Chicago Board Options Exchange’s volatility index (VIX) has a reliable history of signaling S&P 500 (SPX) tops. Some analysts/traders believe the VIX making a new low is bearish. This in most instances is a bullish signal.
The daily VIX/SPX chart courtesy of Trading View illustrates their action since late 2019.
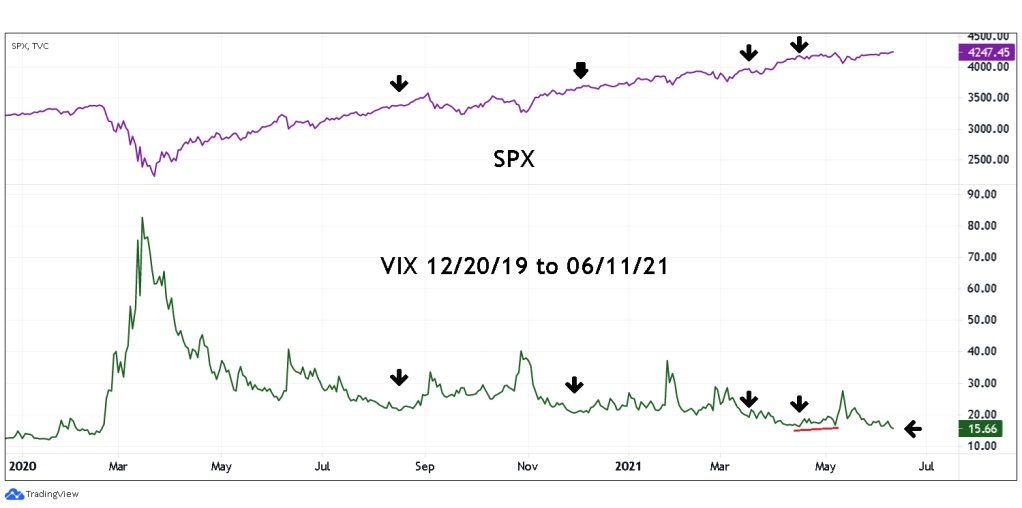
Note the SPX 05/07/21 peak came when the VIX was recording a higher reading vs. its 04/16/21 bottom.
Prior to 04/16/21 there were three other times when the VIX making a new low was a reliable SPX bullish signal.
The SPX rally since the 05/13/21 bottom counts bests as the final fifth wave of an Elliott- Impulse wave up from the 03/23/20 bottom. Additionally, the intraday action of the post 05/13/21 rally is choppy – the signature of Elliott wave Ending Diagonal Triangles (EDT). The most likely wave count since 05/13/21 has the SPX in the process of a still forming EDT. If this count is correct the SPX is currently somewhere in the third wave of the EDT.
If the SPX continues to make new highs it could be a slow and struggling rally, much like what we’ve witness in the last few weeks.
For at least a week profit opportunities for both bulls and bears could be small. Hold off on trades until there’s more evidence – in particular a VIX bearish divergence against a new SPX all-time high.
