The US stock market is seasonally bullish from November into late April/early May. From 2009 to 2020 the S&P 500 (SPX) recorded five intermediate peaks in the late April/early May time zone. The SPX 2021 high was on 05/07/21. The Dow Jones Industrial Average peak was 05/10/21. The subsequent smooth and steady decline appears to be an Elliott five wave impulse pattern. If so, this is probably the first wave of a larger developing downtrend.
The one-hour SPX chart courtesy of Trading View illustrates the recent price action.
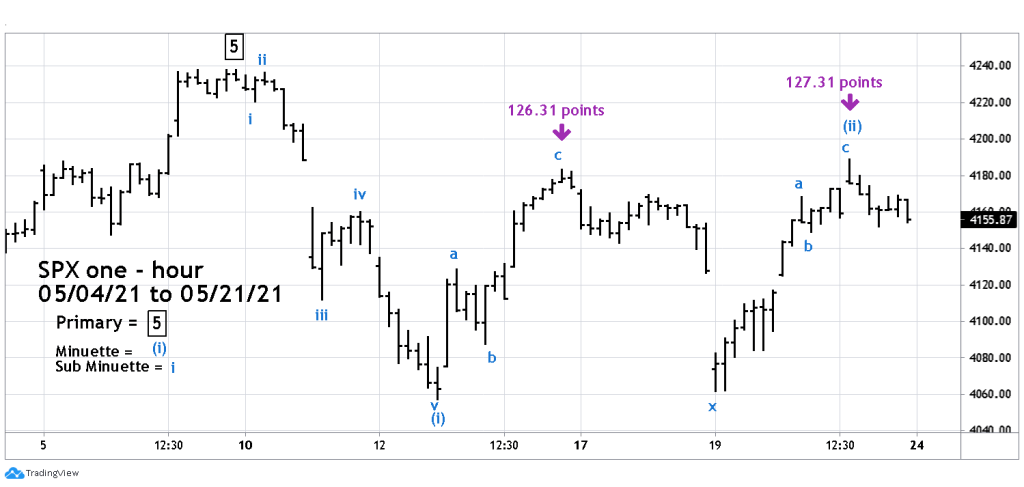
It appears an Elliott wave – Double Zigzag corrective pattern may have completed at the 05/21/21 SPX high. Fibonacci evidence supports this theory. Note the first Zigzag is nearly equal to the second Zigzag – a common occurrence in Single and Double Zigzags.
If this count is correct, it implies a move down to at least the 4060 area. A break below the bottom of Minuette wave ( i ) opens the door for a powerful decline.
Late May to October is seasonally bearish for US stocks, if this holds true the Double Zigzag pattern could be the first rally within a developing bear market.
Traders are holding short 125% non-leveraged SPX related funds. Continue holding short.
