Recently one of my friends who also analyzes the markets asked me; what was the maximum retracement for Elliott second waves. My answer was 99.9%. Wave “twos” generally have deep retracements, the most common Fibonacci level is .618. Sometimes wave “two’s” can have shallow retracements – there’re in the minority.
The reason wave “twos” have deep retracements, especially after important turn points is that the crowd believes the prior trend is still in effect.
The 30-minute SPX chart courtesy of Trading View illustrates the recent action.
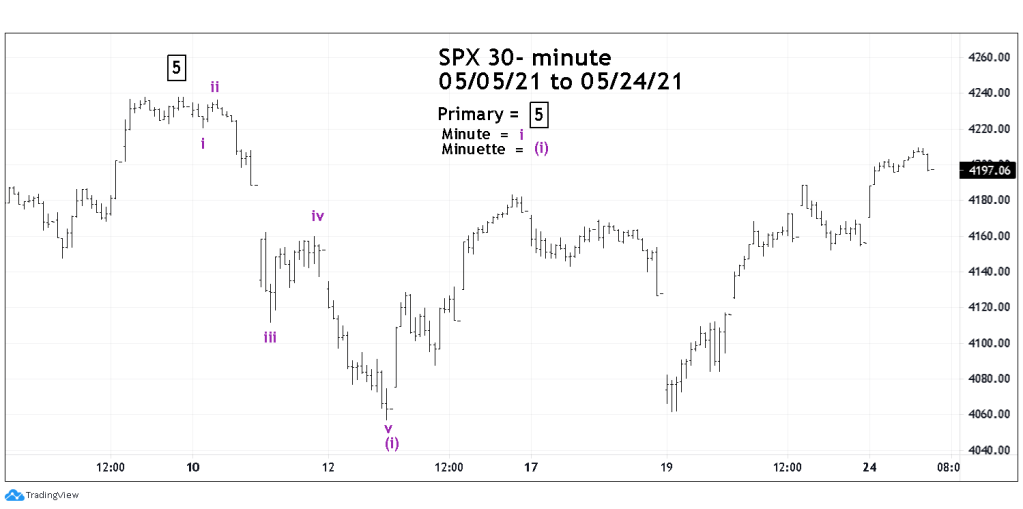
The move up after the Elliott five-wave impulse down has gone beyond the Fibonacci level of .618 and could complete the retracement anywhere up to a .999 retracement.
The general form of the rally still looks like a three-wave pattern, however there are multiple ways to count the sub- waves, the pattern may not be complete.
There’s a high probability the SPX all-time high could hold. Why am I so confident? Besides the massive amount of bearish evidence for US stocks there’s now another factor that strongly suggest the broader speculative mania is complete.
The daily chart of Bitcoin in US dollars (BTCUSD) illustrates that other factor.
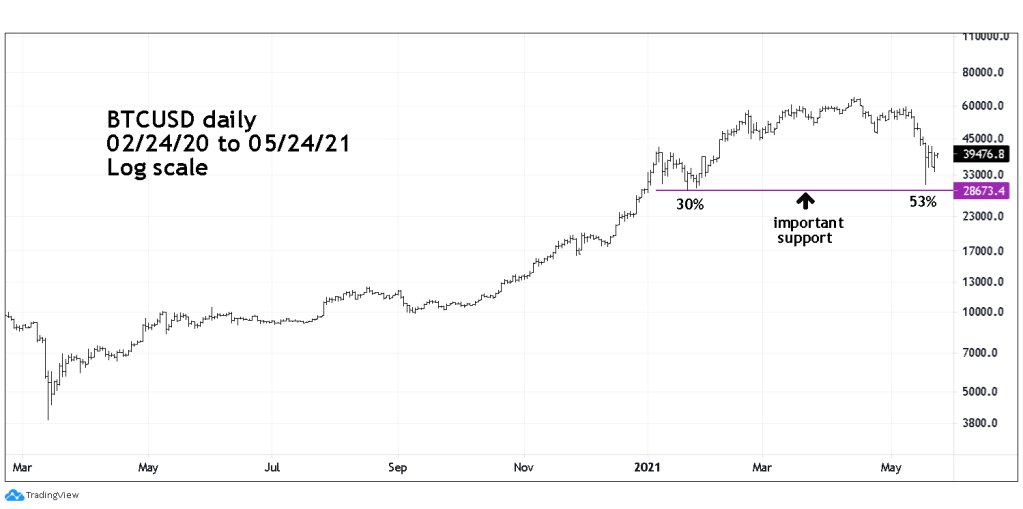
The 05/16/21 blog “Bitcoin Relationship to US Stocks” noted “If within the next few trading days BTCUSD breaks below the 05/13/21 bottom it could open the door for the decline to the 29000 to 31000 area.” The bottom on 05/19/21 was 30066.00.
At 30066.00 BTCUSD was down 53% from its April 2021 all-time high, much larger than the biggest correction within the 2020 to 2021 bull move. The rapid and massive 53% drop by itself is powerful evidence that the Bitcoin speculative bubble has probably burst.
Bitcoin’s mania was much more intense than the SPX mere 93% gain in fourteen months. My guess is that the Bitcoin bulls consider the 53% drop as a buying opportunity. That sentiment could change if BTCUSD breaks below the 05/19/21 bottom. It could also change the sentiment view of US stocks.
Today 05/24/21 traders were stopped out of a 25% short position on non-leverage SPX related funds when the SPX moved above 4207.90. The percentage move from the short initiation point of 4073.77 was 3.30% the loss on the 25% position was 0.82%.
Traders are holding short 100% non-leveraged SPX related fund. Continue holding short.
