The S&P 500 (SPX) opened the 05/19/21 session down sharply and below the supposed “b” wave low of a rising Elliott wave – Single Zigzag. A 25% short of non-leveraged SPX related funds was initiated at the opening SPX price of 4073.77. Use a move above SPX 4207.90 as the stop loss for the 25% position.
A main reason for the drop in US stocks was the giant move down in the Bitcoin market. The prior post “Bitcoin Relationship to US Stocks” noted what could soon happen to Bitcoin in US dollars (BTCUSD). “If within the next few trading days BTCUSD breaks below the 05/13/21 bottom it could open the door for the decline to the 29000 to 31000 area. A break below the 05/13/21 bottom could also be an important bearish indicator for US stocks.”
On 05/19/21 BTCUSD reached 30066.00. BTCUSD from 04/14/21 to the 05/19/21 low declined an amazing 53%! From March 2020 to April 2021 the largest BTCUSD correction was the January 2021 30% correction. A 53% drop in just over one – month strongly implies BTCUSD is in a bear market that could continue for several months. The bursting of the Bitcoin bubble is an indication the speculative mania in stocks may also have ended.
The daily SPX chart courtesy of Trading View illustrates the 05/19/21 decline.
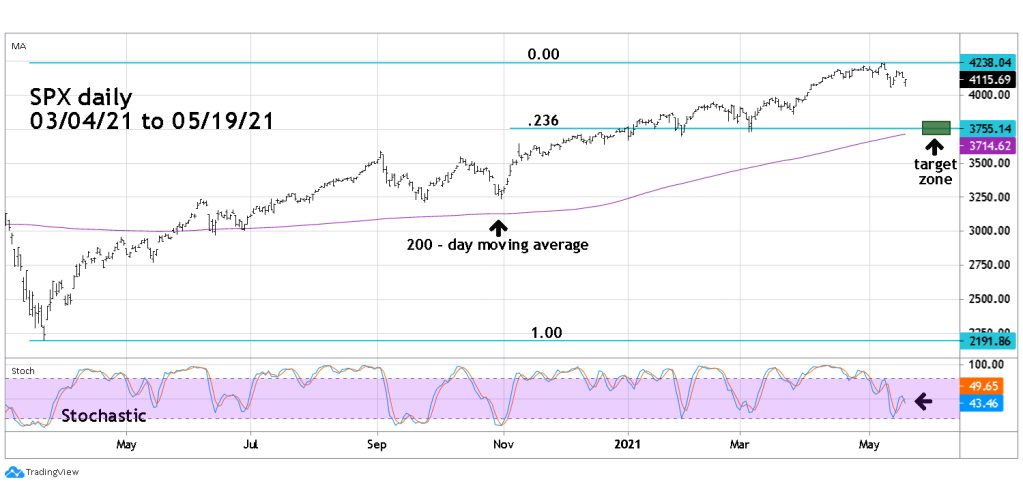
The bearish Stochastic lines crossover implies more decline. If so, the SPX could reach the downside target in the first week of June 2021.
