The 02/15/21 blog “Using Bitcoin as an Indicator for the US Stock Market” examined the relationship between Bitcoin in US Dollars (BTCUSD) and the S&P 500 (SPX).
The weekly BTCUSD/SPX chart courtesy of Trading View updates the relationship.
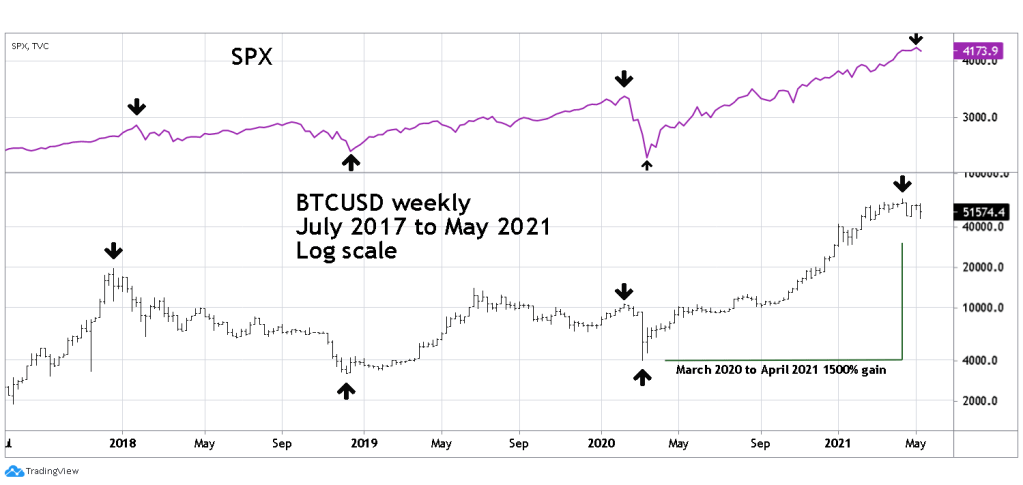
The most striking feature of this chart is the dramatic BTCUSD bull move from March 2020 to April 2021. The gain is more than 1500%, it makes the Nasdaq 100 rally from 1998 to 2000 of 350% look puny in comparison. The Bitcoin 2020 to 2021 rally is one of the biggest manias in world history.
From 2017 to 2020 there have been four key turning points shared by BTCUSD and SPX.
Late 2017 to early 2018 BTCUSD topped five weeks before the SPX.
Late 2018 BTCUSD bottomed one week before the SPX.
February 2020 BTCUSD and SPX topped in the same week.
March 2020 BTCUSD bottomed one week before the SPX.
In 2021 the BTCUSD all-time high in April 2021 was three weeks before the SPX all-time high.
The February 15, 2021 post noted “As of February 12, 2021, both BTCUSD and SPX were making new bull market highs. If BTCUSD continues its relationship, SPX could make a new high one week to a month and a half after BTCUSD makes its bull market climax.”
The most recent BTCUSD turn of three weeks before the SPX all-time high is within the expected range based on the data from the prior four BTCUSD/SPX turns.
The daily BTCUSD chart illustrates the more recent action.

The 04/14/21 to 05/13/21 29% decline is close to the January 2021 correction of 30%. The 05/13/21 bottom is marginally below a 50% retrace of the January to April rally and in the area of the minor February 2021 decline.
As of 05/13/21 a correction within the BTCUSD bull market could be complete. However, daily Stochastic on 05/12/21 had a bearish line crossover. The lines as of 05/14/21 are in the middle of the neutral zone implying more downside action.
If within the next few trading days BTCUSD breaks below the 05/13/21 bottom it could open the door for the decline to the 29000 to 31000 area. A break below the 05/13/21 bottom could also be an important bearish indicator for US stocks.
Traders are holding 100% short non-leveraged SPX related funds. Short an additional 25% non-leveraged SPX related funds if the SPX moves below 4087.20. Use a move above SPX 4207.90 as the stop loss for the 25% position.
