The US stock market is late in the bullish season with long- and short-term bearish momentum signals, yet the rally continues. Could it rise for several weeks or months without at least a correction? Highly unlikely, at some point all trends end.
On 04/29/21 the S&P 500 (SPX) and the Nasdaq Composite (IXIC) made new -all time highs. This is a potential bullish “Rule of the majority” signal but as I’ve noted before this signal may not be valid in a blow off top. The nature of the April 2021 rally looks like a blow off top.
The daily VIX/SPX chart courtesy of Trading View illustrates a short- term bearish sentiment signal.
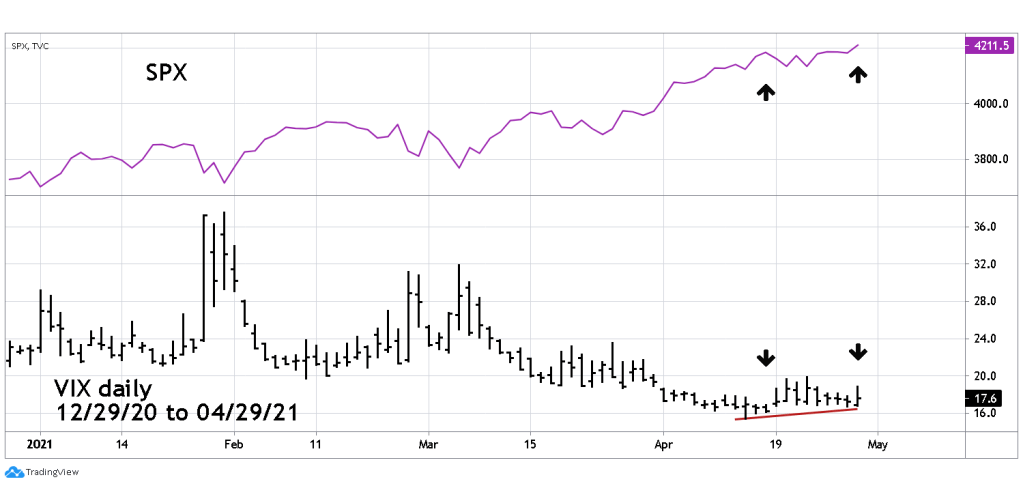
The VIX usually makes higher bottoms when the SPX registers intermediate and major tops. In March 2021, the VIX had higher bottoms with SPX all-time highs but subsequently the VIX made a new low. Now the divergence has reappeared – currently a double divergence. Keep an eye on the VIX, lets see if this divergence holds.
The SPX on 04/29/21 opened above the stop loss level of 4210. This was a 50% position from a trade initiated on the SPX open 04/12/21. The total move up from 04/12/21 to 04/29/21 was 2.28%, the loss for the 50% position was 1.14%. A recommendation was made to short 50% non-leveraged SPX related funds on a move below SPX 4114.82. This remains a recommendation.
The very short-term Elliott wave pattern is unclear. The situation could be clarified by 04/30/21.
On 04/28/21 there was a tremendous amount of bearish evidence, and it was stunning to see the SPX and IXIC make new highs. At the 04/29/21 SPX session end there was still a tremendous amount of bearish evidence. The action of US stocks on 04/30/21 could break the back of the bull market.

Thanks for this timely and vital information, Mark!
LikeLike
Thanks so much, Mark, for this timely and vital information. Hope you are personally thriving in the market!
LikeLike
Happy I can help.
LikeLike