Markets are a form of non-violent warfare; each trading days is a constant battle for dominance between the bulls and bears. Determining strong points defended by bulls and bears, known in trading as support/resistance is key to knowing which side could prevail. A strong area of support for the S&P 500 (SPX) has appeared that could determine the winner of the battle of US stocks in May 2021. If support holds bulls could push the SPX to new all-time highs. Breakthrough of the battle line opens the door to potential downside havoc.
Before examining the battle line an examination of SPX momentum is needed. The daily SPX chart courtesy of BigCharts.com illustrates three momentum indicators.
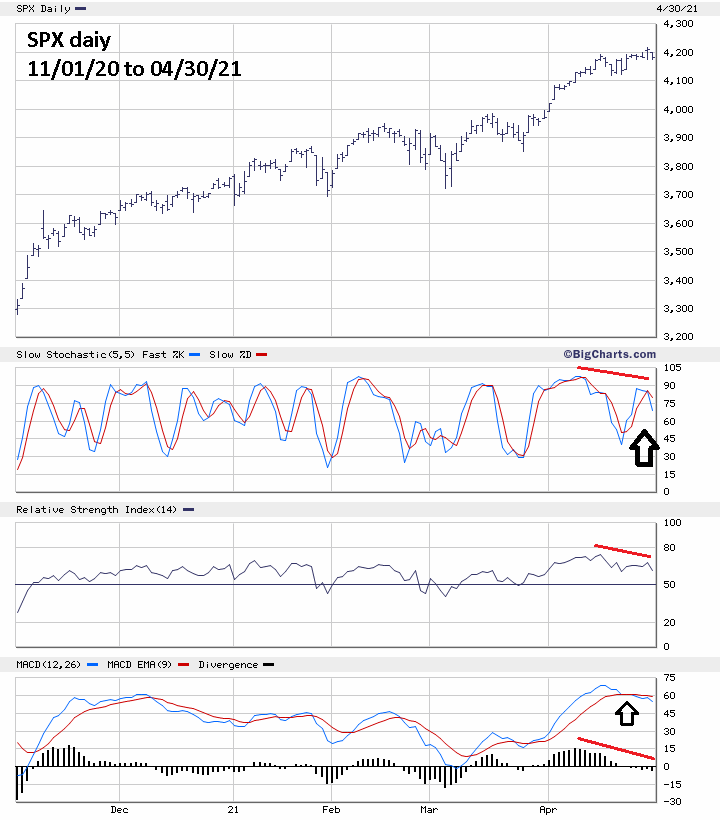
Daily Stochastics has a bearish divergence and line crossover in the overbought zone. RSI has a bearish divergence from the 04/16/21 high and has a double bearish divergence from the 09/02/20 high – not shown on this chart. MACD has a bearish line crossover, the Histogram has a bearish divergence and is below the zero line. In context with the bigger picture, weekly SPX Stochastic has a bearish line crossover in the overbought zone.
The 3 – minute SPX chart courtesy of Trading View illustrates some interesting price action.
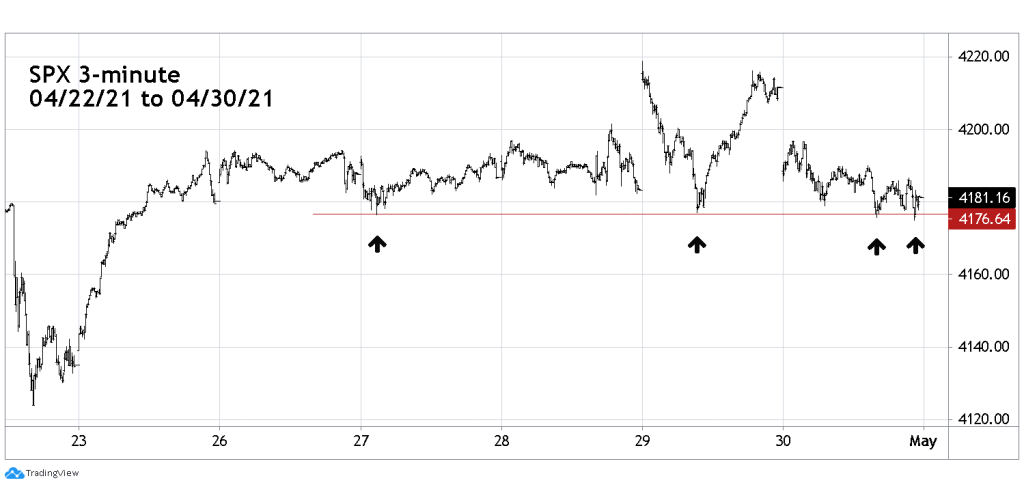
On 04/29/21 the SPX found support almost at the exact bottom made 04/27/21 creating a clear double bottom. On 04/30/21 there were two marginal breaks below the double bottom, both attempts were quickly repulsed by the bulls. Holding of the battle line appears to be a bullish victory, however there could be one more barrier just below the 04/30/21 bottoms.
The 1 -minute (SPX500) Point & Figure chart illustrate an additional support area.

SPX500 is a symbol used on Trading View, its similar to a continuous S&P 500 futures contract. I’m using SPX500 for this illustration because its price levels are close to the SPX.
SPX 500 also shows activity outside of the SPX session 9:30 AM – ET to 4:00 PM -ET – Monday to Friday.
A point-and-figure chart plots price movements without taking into consideration the passage of time. P&F charts utilize columns consisting of stacked X’s or O’s, each of which represents a set amount of price movement. The X’s illustrate rising prices, while O’s represent a falling price. P&F charts are good at discovering support/resistance because it filters out tiny price movements and is less susceptible to false breakouts.
The P&F chart shows a support area that occurred three hours before the open of the SPX session on 04/26/21. On SPX500 the bottom is 4173.18 and is close to a prior bottom at 4173.89 made Sunday 04/25/21. This double bottom is the battle line.
The SPX500 low on 04/30/21 was 4176.12 – 4173.18 = 2.94.
The SPX low on 04/30/21 was 4174.85 – 2.94 = 4171.91 as the SPX battle line.
With bearish SPX daily and weekly momentum signals there’s a high probability the battle line could be reached. Note on the SPX 3-minute chart that if the battle line is broken there’s no chart support until the 4140 area. A break below the battle line opens the door for a rapid descent to 4140.
Within the context of a waning bullish season combined with bearish sentiment and momentum evidence, a move to 4140 could be the kickoff of at least a two week 10 to 12% decline.
Cancel the recommendation to short 50% non-leveraged SPX related funds on a move below SPX 4114.82.
Short 100% non-leveraged SPX related funds on a move below SPX 4171.80. If the SPX opens below this level short immediately after the open.
Use a move above SPX 4218.78 as a stop loss on half the position.
Use a move above SPX 4240.00 as a stop loss for the other half of the position.

Perhaps one of your most vital market post ever.
Extremely well done, coving the entire spectrum of analysis.
Bearish divergences are notable, across the board.
The information posted here is for a trader like myself, simply invaluable.
Thank you.
LikeLike
Thanks for the compliment.
LikeLike