Today 04/26/21 the S&P 500 (SPX) slowly struggled to rise. It took almost the entire session to break above the all-time high of 4194.17 made on 04/23/21. The breakout was.02 points reaching 4194.19 – the SPX then sharply fell below the low of the session.
Interestingly the VIX – volatility indicator rose during the session. This is unusual because the VIX normally falls when the SPX goes up. With the SPX closing above its 04/16/21 closing level, the daily VIX now has a double bearish divergence vs. the SPX.
The Nasdaq Composite (IXIC) also went up today and is still below the all-time high made 02/16/21.
One area that trended down during the day was the Consumer Staples Select Sector SPDR Fund (XLP). This sector fund has the clearest Elliott wave count since the March 2020 bottom.
The weekly XLP chart courtesy of Trading View illustrate its progress since the chart shown in the 03/23/21 post “Crash Bottom Anniversary Day”.
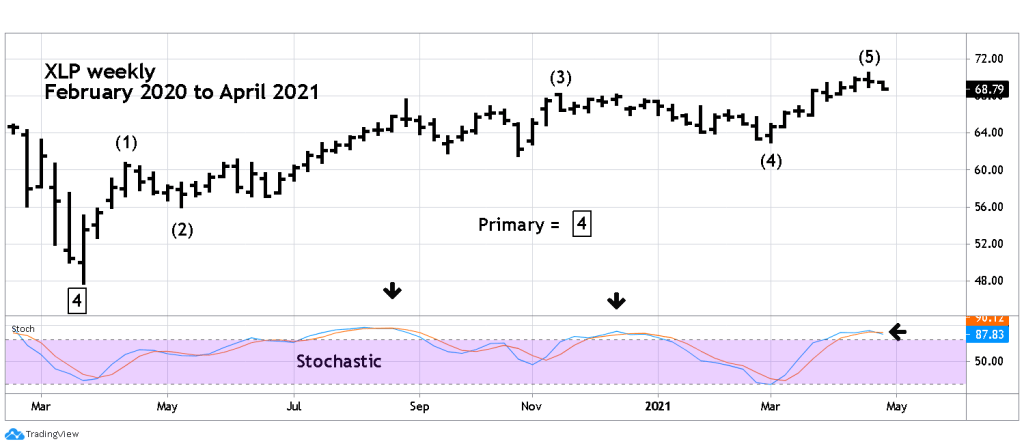
Five Intermediate degree waves can be counted up from the March 2020 bottom. Weekly Stochastic has a bearish crossover. The last two weekly bearish crossovers were followed by multi- week declines.
The daily XLP chart zooms in on the action since February 2021.

The supposed Intermediate wave (5) shows that five minor degree waves can be counted as complete. Daily Stochastic has a solid sell signal. Daily RSI reading today was below its 04/01/21 level, this implies SPX price could at least trade down to the 04/01/21 level. Daily MACD has a bearish crossover, and the Histogram is below the zero line.
One other interesting factor, today 04/26/21 is the eleventh anniversary of the 04/26/10 SPX peak. April 26, 2010 was the high point of the rally that began at the major bottom of March 2009. I label this rally as Primary wave “1” of the secular bull market that began March 2009. 04/26/10 was two days before a full moon. There’s a full moon 04/27/21.
