At the close of trading 04/22/21 it looked like the US stock market was in the process of a bearish rollover. The next day – bulls strongly disagreed. On the surface the powerful rally looks sustainable, viewed in a broader context it reveals many bearish signals.
When only one of the three main US stock indices; S&P 500 (SPX), Dow Jones Industrial Average (DJI), and Nasdaq Composite (IXIC) make a high/low unaccompanied by the other two main indices, I refer to it as a “Rule of the majority” signal. The truth of the markets direction is with the non-confirming indices. These signals can occur at major, intermediate, and minor turns.
Since February 2021 there have been a few “Rule of the majority” bearish signals, none have held. Several factors imply the bearish signal made on 04/23/21 could be decisive.
The hourly SPX chart courtesy of Trading View illustrates intraday momentum.
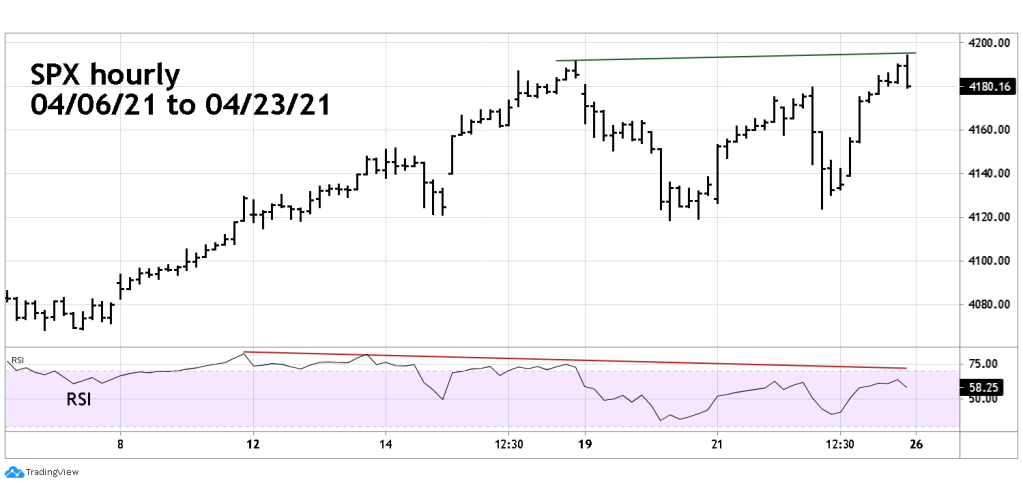
On 04/23/21 only the SPX made a new all-time high as it pushed marginally above its 04/16/21 peak. The hourly RSI reveals a double bearish divergence from its momentum high recorded on 04/09/21. This implies at least a multi-day SPX decline. There are now monthly, weekly, daily, and hourly SPX- RSI bearish divergences.
The hourly DJI chart shows that this index not only failed to exceed its 04/16/21 all-time high, but it also diverged against the short-term peak made on 04/21/21.

The hourly IXIC chart illustrates its continuing failure to break above its all-time high registered on 02/16/21.
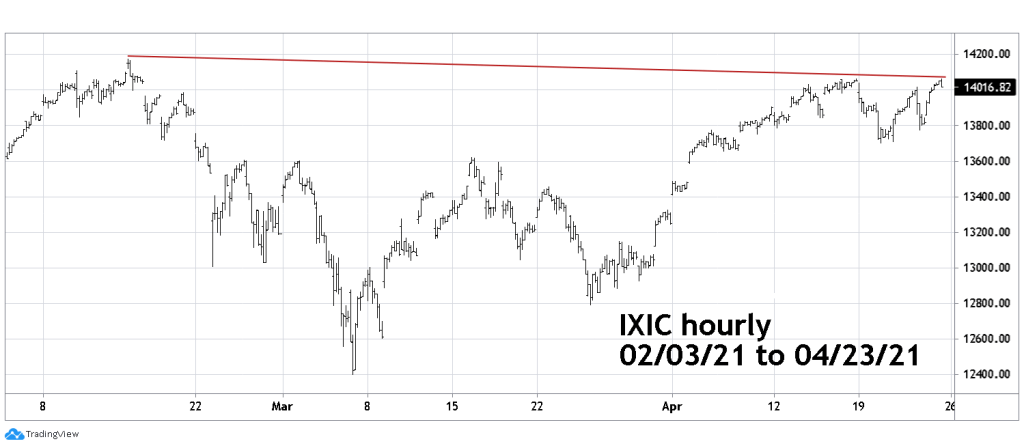
This by itself is a very bearish signal. From 03/23/20 to 02/16/21 IXIC was the strongest of the three main US stock indices – now it’s the weakest. IXIC led the bull market, now perhaps its leading a new bear market.
The daily VIX charts illustrates a short-term sentiment signal.

VIX made a new post March 2020 low on 04/14/21 on 04/16/21 the closing SPX all-time high – VIX had a higher bottom, a potential bearish divergence for the SPX. Recent VIX divergences have not held. In a few trading days, we could know if the current bear signal is valid.
Context of time
The current bearish momentum and sentiment signals are coming on the cusp of a seasonally bearish time. Two of the most significant SPX peaks within the last eleven years have been 04/26/10 and 05/02/11. The 04/26/10 top is what I’ve labeled Primary wave “1” of the secular bull market since. The 05/02/11 top was followed by a five- month 21% decline.
Time is running out for the bulls; the kickoff of a new bear phase could be imminent. A move below SPX 4114.82 could open the door to a 11 to 12% micro-crash. More about this later, depending on market action.
