This is extremely exciting, the final piece of an Elliott wave pattern that began in March 2009 could be nearing completion.
The daily S&P 500 chart courtesy of Trading View illustrates the Elliott wave count since the beginning of 2021.
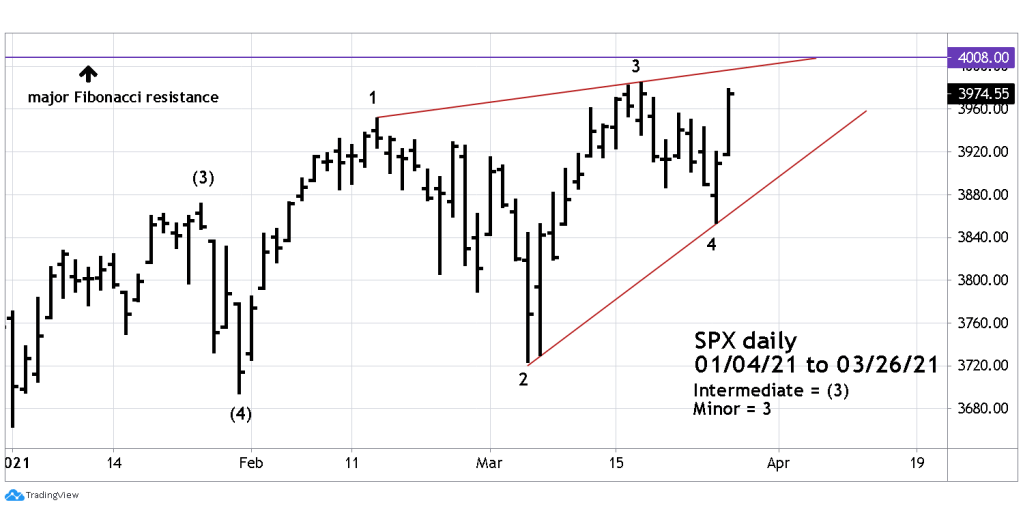
So far, the presumed Minor wave “4“bottom discussed in my prior blog has held. There’s a high probability the subsequent rally is Minor wave “5”. If so the minimum price target for this wave is SPX 3983.88, one tick above the supposed Minor wave “3” peak.
Major Fibonacci resistance is at SPX 4008. The trend line connection the tops of Minor wave “1” and “3” on 03/29/21 will be near SPX 4000.
An Elliott wave – Ending Diagonal Triangle (EDT) from late January 2021 is probably under construction. Typically, in EDT’s there’s a marginal break beyond the trend line connecting the termination points of waves “one” and “three”. If there’s a move above the trend line on 03/29/21 it could terminate near SPX 4008.
The 15 – minute SPX chart zooms in on the intraday Elliott wave count.

Each of the five waves of an EDT sub divide into three-waves or a combination of three waves. If the wave count illustrated is correct, the final part of Minor wave “5” could be complete on 03/29/21.
There’s usually a relationship between motive waves “one” and “five”. The supposed Minor wave “1” of the EDT was 256.31 points. Two possible Fibonacci relationships of waves one to five are .50 and .618.
256.31 x .50 = 128.15 + Minor wave “4” bottom 3853.65 = 3981.80
256.31 x .618 = 158.40 + Minor wave “4” bottom = 3853.65 = 4012.05
March 29, 2021 could be an important date in the history of the US stock market.
