Short-term Sentiment
At important market peaks the evidence is not universally bearish, The same for important market bottoms, there’s usually at least one factor that is contrary to the weight of evidence.
The VIX indicator continues to be bullish. I’ve noted in prior posts that the VIX usually makes a higher bottom at S&P 500 (SPX) important tops. This phenomenon has occurred many times over the course of several years. On 03/26/21 while the SPX was only marginally below its all-time high the VIX recorded a new low in its decline from March 2020. This implies the SPX could continue to climb for at least several days. The prior blog noted the SPX could peak on 03/29/21.
Could the VIX be giving a false bullish signal? The daily SPX chart courtesy of Trading View may have the answer.
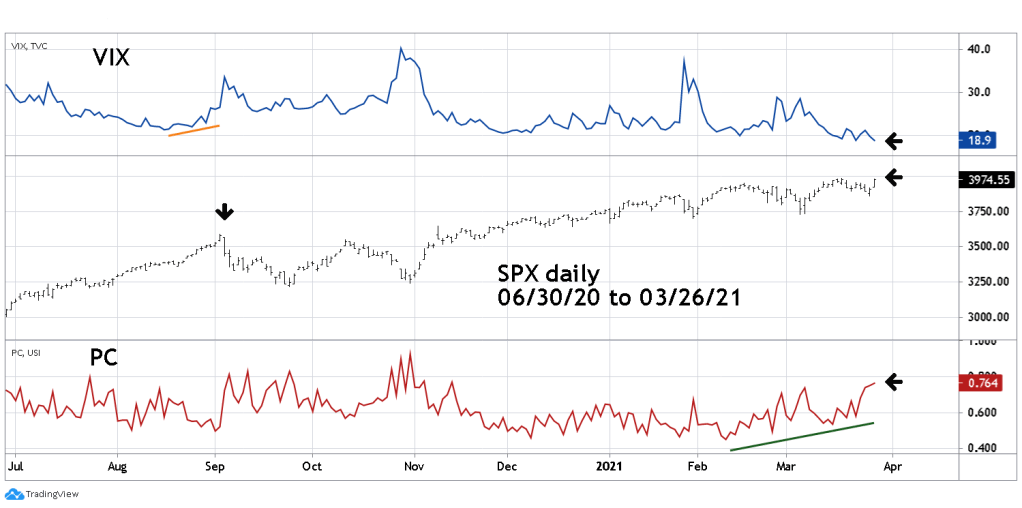
The VIX is derived from S&P 500 index options. Another tool to analyze short-term market sentiment is the Put/Call ratio. The Trading View symbol for the Total Put/Call Ratio Composite is (PC).
The theory behind sentiment divergences is that they reveal subtle changes of trader opinions. An increase in Put buying as a market rallies implies traders are hedging for a decline. The recent significant ratio increase of Puts vs. Calls agrees with bearish momentum divergences, specifically the monthly, weekly, and daily SPX-RSI.
Consumer Staples Sector
The daily chart of the Consumer Staples Sector – Exchange Traded Fund (XLP) illustrates its Elliott wave count.

My 03/23/21 Blog “Crash Bottom Anniversary Day” noted the XLP could reach an area where the supposed Intermediate wave (5) would be a Fibonacci .50 of the supposed Intermediate wave (1). On 03/26/21 this target was reached; however, the subdivisions of Intermediate wave (5) imply more upside action. If so, XLP could climb to around 71.00. Assuming the SPX tops on 03/29/21 its possible XLP could continue climbing for a few more days.
If the XLP completes a five – wave Elliott impulse pattern from the March 2020 bottom, it implies an important peak for that sector and the broader US stock market.

Thanks so much, Mark, for this valuable information. Your technical analysis goes way beyond that of other supposedly stock market gurus. I wish you could host your own TV show!
LikeLike
Thanks for the compliment.
LikeLike
Awesome work as always. Do you think a potential start of a bear market will come is a fall of 10% or more or will it be more of a slow and steady process. The market behavior the last few months has been very interesting
LikeLike
Hi thanks for the compliment. Let’s take one forecast at a time. First we need to see if a top develops. If a top is made the speed of the decline could provide important data. A fast drop is the most likely scenario for the start of a larger bear move.
LikeLike