Evidence is developing that the US stock market could have at least a short-term top or possibly a major peak in early January 2021.
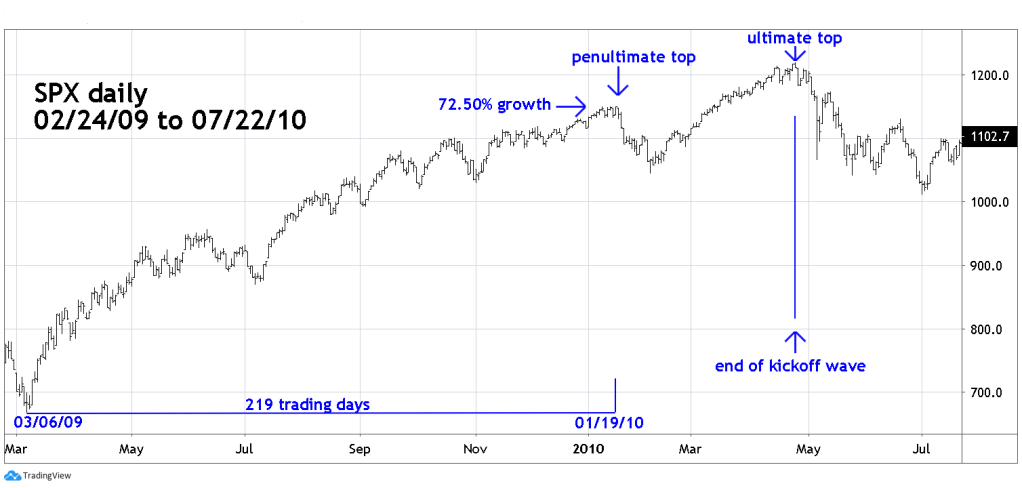
The 12/06/20 post “Strongest Rally of the Bull Market” compared the current stock rally from 03/23/20 with the 2009 to 2010 kickoff phase of the secular bull market. A closer examination of the earlier rally reveals two tops in January and April.
The daily S&P 500 (SPX) chart courtesy of Trading View shows on top made on 01/19/10 after a 72.50% gain from the 03/06/09 bottom. Subsequently there was a correction lasting about two – weeks prior to the final kickoff wave peak in April 2010.
The SPX 2020 daily chart shows the current rally is rising at a faster rate than even the powerful kickoff rally. On 12/18/20 the SPX was close to a 70% gain from the 03/23/20 bottom with more than a month to go before reaching the 2009-to-2010-time frame of 219 trading days.
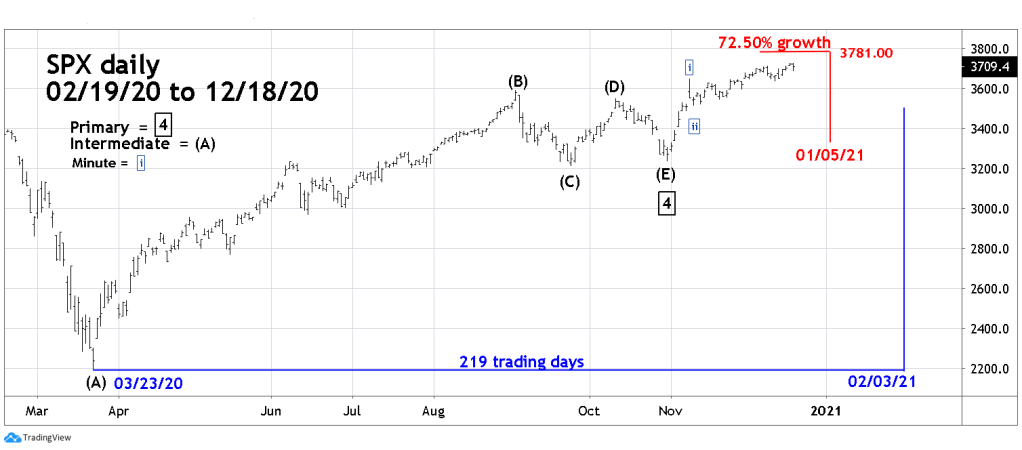
The Elliott Wave count from the 10/30/20 bottom labeled Primary wave “4” – boxed shows the SPX could be in a third wave of a developing five – wave impulse, if so, it’s possible the entire pattern could be complete late in 2020 or in early 2021. The SPX could also be near the 72.50 growth level.
Late October to late April is usually a bullish time for US stocks. Sometimes tops, intermediate or major can occur just after a new year. There’s a factor that could trigger this phenomenon in 2021 which will be examined in a later post if necessary.
One final note about the developing Elliott Wave structure. If there’s a five – wave rally after Primary wave “4” and it completes in late 2020/early 2021 it could be the first wave up of a larger developing five – wave pattern concluding in April 2021. Or it could be the termination point for the entire secular bull market. If so, the subsequent decline could continue for years.
Investors and traders are long non leveraged SPX related funds as of the opening of trading on 11/03/20, continue holding.

Thanks again, Mark, for your technical investment savvy. You know so much more than these so-called financial experts on TV or even the Seeking Alpha columnists. Some of them probably think the Elliot wave is good for surfing in the Pacific Ocean! Enjoy your holidays and keep up the excellent insight!
LikeLike
Thanks, I hope you also have a great holiday season.
LikeLike
Mark, how does this analysis compare with the analysis you presented a few months ago about the Elliot Wave count for SPDR – Consumer Staples (XLP)? How consistent are the two analyses with regard to timing for intermediate and future market tops and which of the two indices (SPX or XLP) do you think is most likely to provide the most reliable Elliot Wave count for predicting the future roadmap for the US stock market?
LikeLike
Hi Great question. When I wrote the post about XLP the SPX pattern was unclear and open to many interpretations. Since
the SPX bottom on 10/30/20 the pattern for that index has cleared. In the near-term, since 11/19/20 the XLP rally has clouded the wave count. I have a hunch of what that pattern is forming but I need further wave progress before posting the wave count.
For now the SPX has a clearer Elliott pattern than XLP. I suspect that in the coming weeks there could be very clear patterns for both indices. If that happens it could provide tremendous confirmation of what could be a very significant top for US stock.
I will provide updates on the XLP and other indices that could also confirm or disagree with the SPX wave count.
Mark
LikeLike