Occasionally stock market turns come at the cusp of a new year. Sometimes like in late 2018 the turn could be a bottom. Usually, the turns come at a top. The main reason is tax deferment. Fund managers and individuals with unrealized stock gains sell early in the new year deferring the taxes on the gains.
The daily S&P 500 (SPX) courtesy of Trading View shows that the first trading day of 2005 was an intermediate peak followed by an intermediate size drop that lasted into April 2005. Note the bearish RSI and MACD divergences at the January peak.

The year 2000 marked the end of a multi-year bull market and a massive bubble in Technology stocks. On the first trading day of January 2000 the leading tech stock in the mania – Qualcomm Inc. (QCOM) made its peak at $100.00, after a one – year increase of over 2000%.
The daily Dow Jones Industrial Average (DJI) was able to continue its rally for about two-weeks before peaking. The other two main US stock indices, SPX, and Nasdaq Composite (IXIC) made their respective tops two months later. This is typical of major peaks where the topping process could continue for three to four months.

Perhaps if a significant US stock top occurs in 2021, each of the three main stock indices will peak on different days.
The daily SPX 1990 chart shows an intermediate top occurring on the second trading day of 1990 at the same price level as the prior peak made in October 1989.
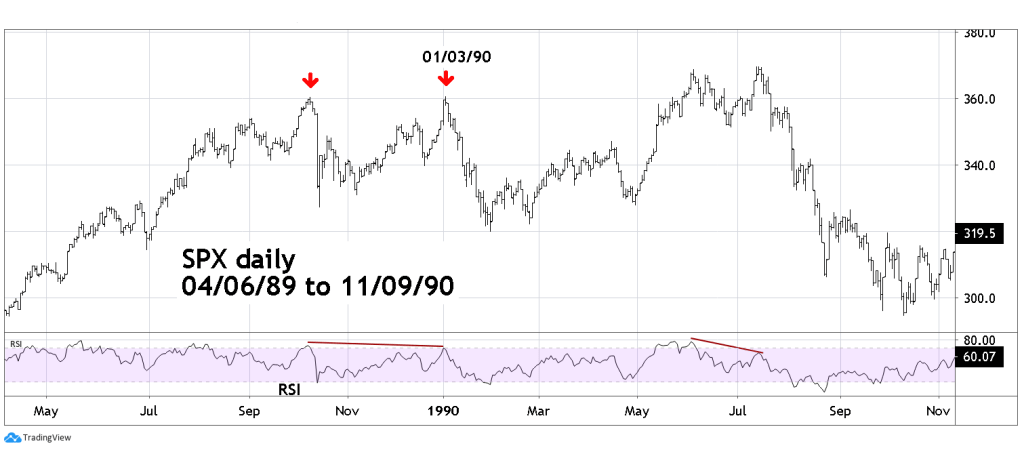
The phenomenon of early new year tops is not confined to the US stock market. In its first trading day of 1990 Japan’s Nikkei – 225 (NI225) stock index completed a multi-year bull market. The subsequent bear market declined 63% before putting in an intermediate degree bottom in August 1992. As of December 2020, the NI225 still has not been able to exceed its January 1990 peak.
The DJI daily chart illustrates a peak made on 01/11/73 concluding a bull move that lasted more than two and a half years. The subsequent bear market lasted more than two and a half years declining 46% – the deepest US stock market drop since the 1930’s.

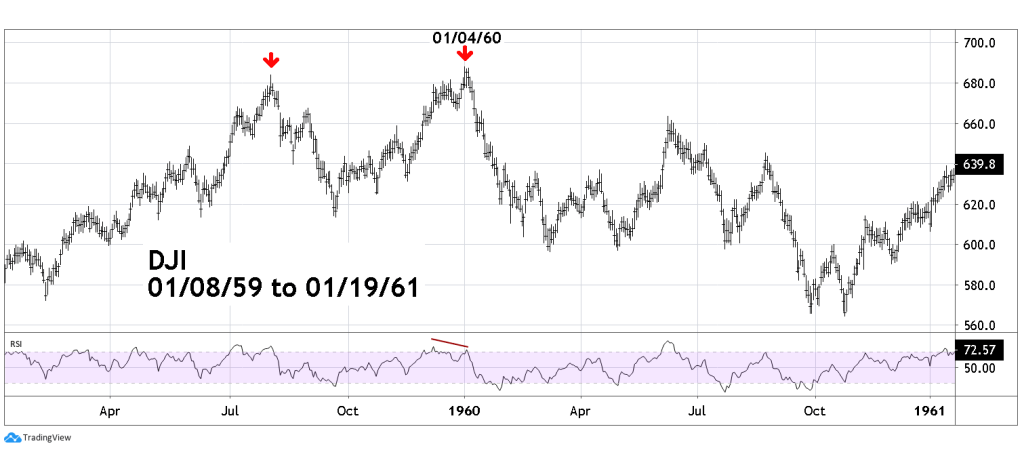
The final daily DJI chart shows a bull market top on the first trading day of 1960 and matching the prior peak made in August 1959.
The conditions are ripe for at least one of the three main US indices to make some degree of top in during the first week of trading in 2021. The 12/20/20 post “US Stocks Topping in Early January 2021?” noted that the SPX would equal the percentage gain from the 2009 bottom to the January 2010 penultimate top at 3781. Today, 12/29/20 the SPX high was 3756. Its looking like the SPX could reach 3780 area next week. If so, it could be a time to sell some stocks.

Yes perfect! I do see a significant 5-8% correction in Jan but with possibly last rounds of stimulus coming thru next month this correction could be bought one last tome till early march 2021 for a top around 4300-4400 SPX(long term fibs align there too). It is within your 2 month top forming boundary. You may mention your view against or for this. We will likely fall very fast from there.
LikeLike
Hi thanks for the comment.
You are correct that additional stimulus could trigger more rally. If there’s a decline in January – a slow choppy move could be the first clue of more upside.
LikeLike
Keep up the great work! The end of the secular bull? Fascinating at times like this.
LikeLike
Hi
Thanks for the compliment. The next few week could be a very interesting time for the stock market.
LikeLike