On 12/04/20 all three main US stock indices made new all-time highs which is a bullish momentum signal. Additionally, underneath the surface the number of new 52 – week highs for both the New York Stock Exchange (NYSE) and the Nasdaq Composite registered bullish signals.
The 09/05/20 post “NYSE-New – 52 – Week Highs” illustrated the history of new NYSE – 52 – week highs since the start of the US secular bull market that began in March 2009.
The following chart courtesy of Stockcharts.com shows the Nasdaq Composite 52 – week highs since 2009.
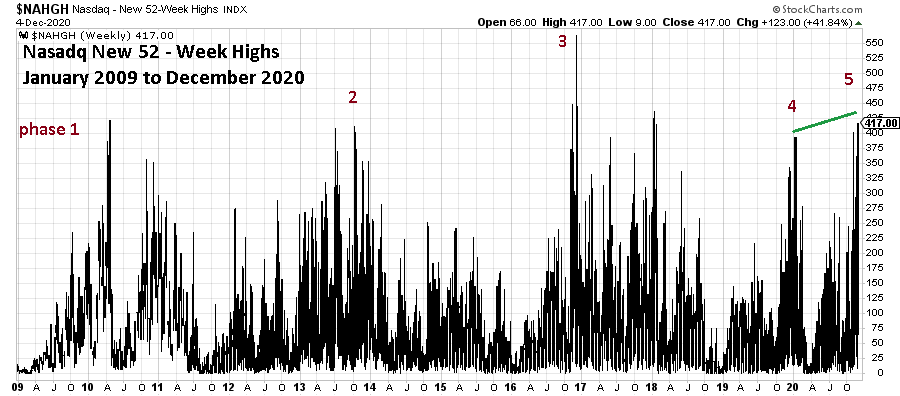
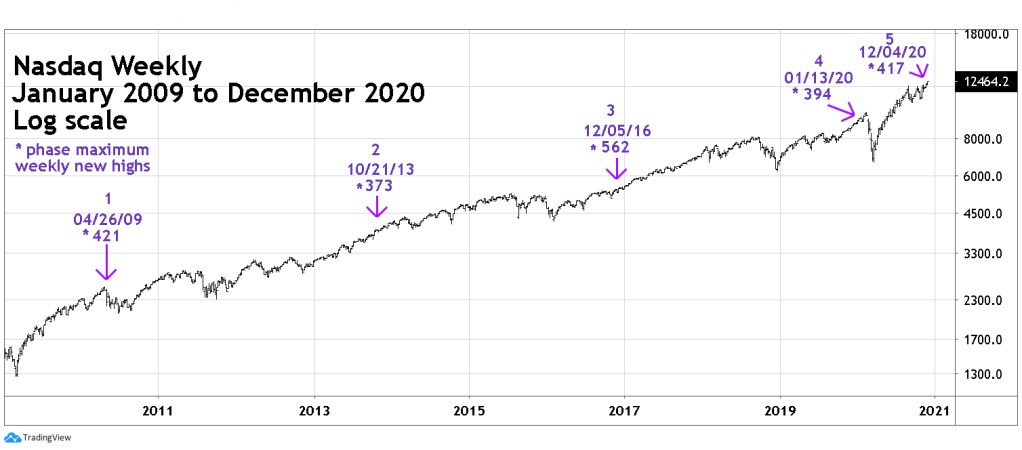
This chart like the NYE new high chart separates the bull market into five phases. The Nasdaq new high configuration is different than the NYSE new highs. The biggest difference occurred on 12/04/20 with the Nasdaq registering the maximum number of phase five new highs. The 09/05/20 post noted that index price peaks usually happen several months after the maximum number of new 52 -week highs. If the Nasdaq new highs made on 12/04/20 holds it implies the Nasdaq price high could come in the later part of the bullish season – late April/early May.
Another intriguing aspect is that Nasdaq phase five new highs have exceeded the phase four maximum. This opens the possibility that after a Nasdaq phase five price peak and subsequent decline – Nasdaq could later, perhaps in 2022 make another new all-time price high.
For now, lets take one forecast at a time – the possibility Nasdaq could continue to rally into April/May 2021.
The next chart shows when each phase maximum new highs occurred.
The final chart of new NYSE 52 -week highs illustrates a different type of bullish signal.

After the 11/09/20 maximum phase five new highs was made prices continued higher, yet new highs decreased creating a bearish divergence. On 12/4/20 these bearish divergences were erased. This is typical of late-stage stock bull market which could have several false bearish signals before the final price peak is in place.
So far, the 11/09/20 NYSE new high maximum has not been exceeded. If this high holds it may imply a Nasdaq top after the S&P 500 and Dow Jones Industrial Average record their respective bull market peaks.

Thanks, Mark, for giving us hope for Q1 of 2021. With this pandemic pandemonium, it’s nice to hear some good news.
LikeLike
You’re welcome.
LikeLike