Prior posts on this website have shown the Exchange Traded Fund (ETF) GLD to illustrate Gold and the ETF – SLV to illustrate Silver. If I make a recommendation to buy Gold and Silver the physical metals will also be recommended. Therefore, occasionally I’ll post charts of Gold in US dollars – Trading View symbol (XAUUSD) and Silver in US dollars (XAGUSD).
The weekly chart of Gold – XAUUSD shows a potential bottoming area of two Fibonacci coordinates, assuming a significant low was not made on 11/30/20.
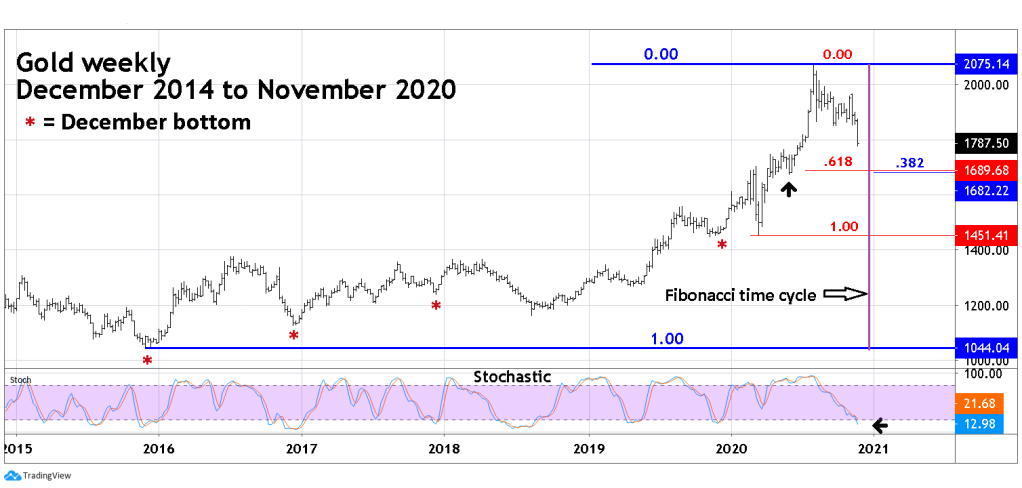
Two Fibonacci coordinates close together could be a powerful support area. Fibonacci retrace/extension points act like magnets and resisters to market movements. The greater the number of Fibonacci points and their proximity increase the power of the magnet/resister.
A .382 retrace of the bull market from 2015 to 2020 is at 1682.22. A .618 retrace of the March to August 2020 bull move comes at 1689.68 extremely close to the first coordinate. Additionally, these points are in the area of the June 2020 correction. This triple layer of support could be a formidable barrier for declining price.
The weekly Stochastic has reached the oversold zone, it’s possible a bottom is in place at the 11/30/20 low. Also note that Gold has made seasonal December bottoms in four out of the last five years.
If the Gold bottom made on 11/30/20 does not hold it could find support at the Fibonacci price levels possibly at the Fibonacci time cycle with a bullseye date of 12/29/20 – the next full moon 12/29/20.
The daily Silver chart XAGUSD shows the next significant Fibonacci support level.

Note that Silver also had a bottom on a full moon with the daily Stochastic in the oversold zone.
The situation on Gold and Silver will be closely followed with posts issued when necessary.

Wow, Mark, this is really interesting information — way beyond anything that I read on Yahoo Finance. Thanks for your insight!
LikeLike