The S&P 500 (SPX) rally that began 03/23/20 to 12/04/20 has the largest percentage gain in the shortest amount of time since the secular bull market began in March 2009. As of 12/04/20 the SPX had gained 68.7% in 179 trading days. Extraordinarily strong and fast stock market rallies usually occur at the beginning of a bull market, referred to as a kickoff rally. Sometimes powerful up moves happen in the final bull market phase. It’s possible the rally that began in March 2020 is a “Termination Wave” for the entire secular bull market.
The SPX daily chart courtesy of Trading View illustrates the bullish action since 03/23/20.

The closest move to the 2020 bull run came in 2009 which is shown in the daily 2009 to 2010 chart.
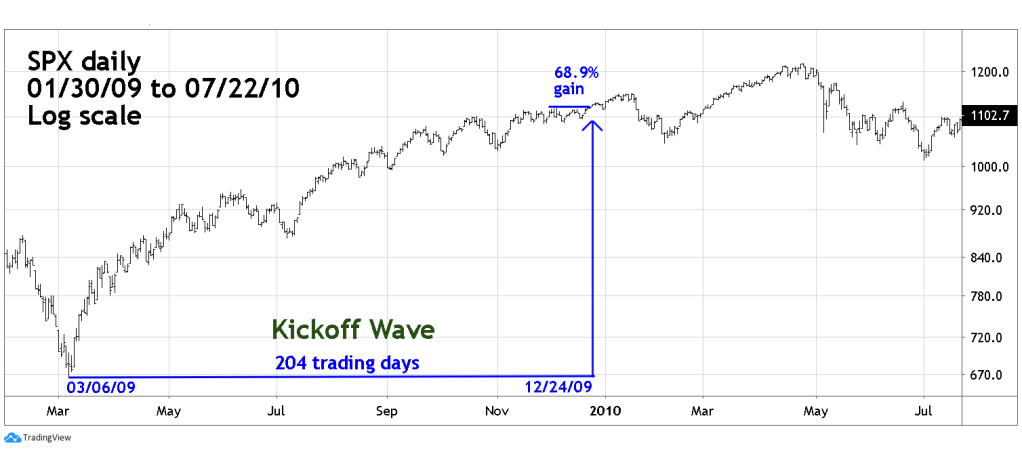
The SPX 2020 rally has achieved approximately the same gain as the kickoff rally in a shorter amount of time, 179 trading days vs. 204 trading days.
The weekly SPX chart puts both rally in the perspective of the entire secular bull market.

A case could be made that the rally from 03/23/20 is the Kickoff phase for a new bull secular bull market that could continue for several years. The evidence argues against this theory.
The 09/05/20 post “NYSE – New – 52 – Week Highs” illustrated that phase – 1, the kickoff rally had a maximum number of new highs of 674. The maximum new highs for the 2020 rally is so far only 566. On 12/4/20 At a higher price high, new 52 – week highs were 504. The internal momentum for the 2020 rally is weaker than the 2009 bull run.
Additionally, the 2009 rally came after a seventeen – month 57% decline. The 2020 up move came after a one month 35% drop. It’s more likely that the 2020 rally is part of the on-going secular bull market and probably the termination phase.
Broader seasonal time zone for US stocks is from late October to late April/early May.
Within Elliott Wave theory wave “one” of a five-wave impulse is usually equal in length to wave “five”. If the rally from March 2020 is an Elliott fifth wave it could equal wave one – the 2009 to 2010 bull move at about SPX 4000 on or near 05/05/21.
The weekly Nasdaq Composite chart illustrates a price projection for that index.

The 12/05/20 post “Bullish Booster Shot for US Stock noted that the surge in new – 52 – week highs could keep the Nasdaq rally going into late April/early May. Tying the recent new high surge with Elliott wave analysis suggests at least the Nasdaq Composite could rise into April/May 2021.
Near term seasonal patterns are bullish though December. Sometimes, turns occur just after the new year. If US stocks are rising into late December it could mean a decline of some type happening in early January.
Traders and Investors are long SPX related non leveraged funds as of the open of trading on 11/03/20. Continue holding long SPX positions.

Now, that’s what I call a Santa Claus rally despite the pandemic. Thanks again, Mark, for your sage advice and insight.
LikeLike