This is an educational post to explain stock market momentum. The 11/17/20 blog “Zoom Update – Part Two” noted that Zoom Video Communications Inc. (ZM) could be a signal for a looming bear market similar to Qualcomm Inc. (QCOM) in 2000.
The daily QCOM and S&P 500 (SPX) chart courtesy of Trading View illustrates what happened 1999 to 2000.

An advantage to analyzing stock market is that momentum can be measured by its individual components. As a stock bull market progresses the number of individual stocks making new 52-week highs decrease. If a stock has been a major leader during a bull market fails to make a new 52-week high while the broader market makes new highs, it could be an important signal.
QCOM made its bull market top on 01/03/20 nearly three months later SPX reached its ultimate bull market peak. Note that the initial QCOM drop was 47%, after two and a half years it bottomed – down 87%.
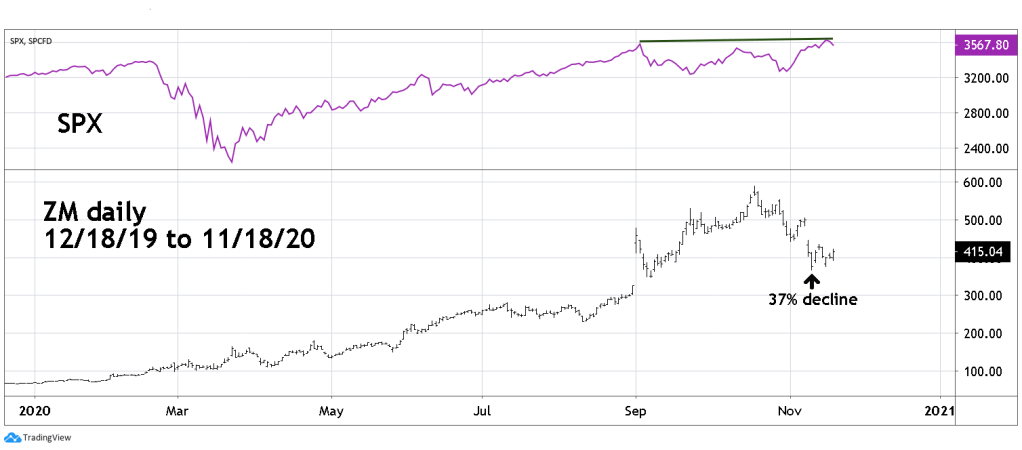
The daily ZM/SPX chart illustrates ZM could be repeating the QCOM/SPX 2000 action. If so ZM’s 10/19/20 bull market high could be forecasting an SPX top in early January 2021.
If ZM continues to lag the SPX it could be one of the most important indicators of a potential major SPX top.

Thanks for emphasizing the importance of momentum investing, Mark. This is a vital step in developing and keeping prosperity. Happy Thanksgiving a little early. I am thankful for your sage advice!
LikeLike
Happy I can help and educate.
LikeLike