The 09/08/20 post “NYSE – New – 52 – Week Highs” illustrated the history of NYSE 52 – week highs of the secular bull market in US stocks since March 2009. Separating the bull market into five phases showed that the maximum number of NYSE – new 52 – week highs occurred in phase 2. Afterwards each successive phase had a lower number of 52 – week highs. This is typical of stock bull markets which see less stocks making new highs as the bull market progresses.
Additionally, within each phase the number of new highs decreases. The NYSE – New – 52 – Week High chart courtesy of Stockcharts.com focuses on the activity since phase 3.
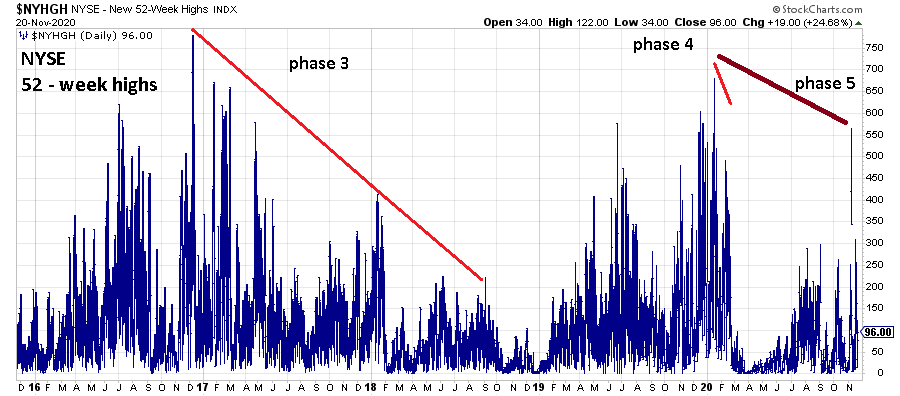
Its possible that the maximum 52 – week highs for the current phase 5 was made on 11/09/20. If within the next several weeks the number of new highs exceeds the peak made in phase 4 – it could be a significant bullish signal. More likely assuming the US stock market continues to rise we can expect to see the number of new highs decrease.
The weekly S&P 500 (SPX) chart courtesy of Trading View illustrates when the maximum number of new highs were reached. The ultimate high in SPX price for phase 3 occurred more than a year and a half after maximum number of new highs. The SPX top for phase 4 happened only a month after the maximum number of new highs.
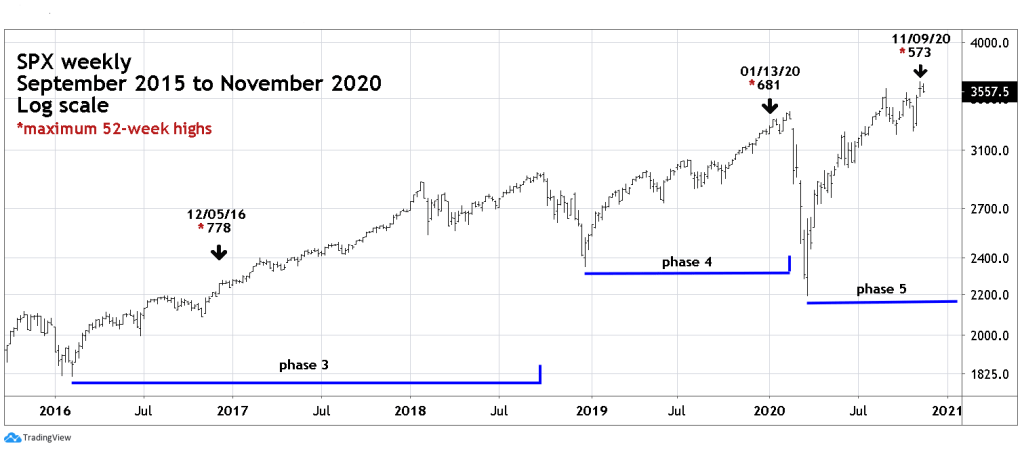
Given such a wide range of when the final SPX high could occur vs. 52 – week highs, it’s unlikely a decreasing number of new high will be precise in timing a phase 5 price peak. Assuming in the next several weeks the SPX continues to rally with decreasing 52 -week highs – it could give an overall cautioning signal of a looming bear market.
New 52 – week highs are just one piece of the puzzle which includes elements from all four market dimensions.
