Evidence was presented in the 08/07/22 blog “The Interest Rate Bull Market” that U.S interest rates may have begun a multi-year bull market. Since then, several blogs on this website forecasted interest rates could continue to climb. The 09/10/26 blog “Upside Targets for U.S. Treasury Yields – September 2026” noted the yields for U.S. 30 – year Treasury Bonds (TYX) could reach 6.00 to 6.50 sometime in October 2026.
On 10/07/26 TYX reached only 5.73, then declined, bottoming at 5.22 on 11/06/26. Has the multi-year U.S. interest rate bull market ended?
The daily 30 – year Treasury bond yields (TYX), 10-year Treasury note yields (TNX), and 5 – year Treasury note yields (FVX) illustrates their relationship.
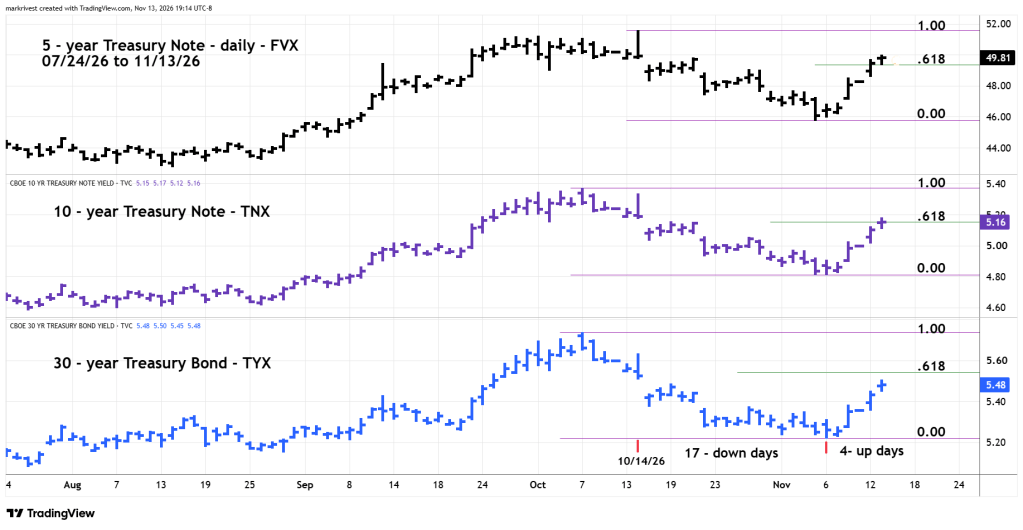
Since early November TYX has rallied to just below a Fibonacci .618 retrace of the October to November decline. TNX and FVX have rallied just above .618 of their respective October to November declines. There’s always leeway around Fibonacci support/resistance. A case could be made that an important resistance zone has been reached. If so, we could expect all three to decline back to their respective early November bottoms and perhaps lower.
However, please note how long the post October decline took vs. the rally since early November.
On 10/14/26 FVX reached its 2026 peak, on that day TYX had a failed rally. The subsequent decline lasted 17 – trading days. The rally back to just below the TYX bottom on 10/14/26 took only 4 – trading days. Rates/yields struggled to go down, then vigorously rallied.
It appears the path of least resistance is up. We could have more conclusive evidence in a few trading days. Watch for TYX to move above its .618 resistance zone as TNX and FVX move further above their respective .618 resistance zones. If so, the U.S. interest rate bull market could continue for several weeks

