The 10/17/26 blog post “Trendline Break/Fibonacci Support” highlighted bullish signals from the daily difference between NYSE 52-week new highs and 52-week new lows, suggesting that the S&P 500 (SPX) could rally for two to three trading days. SPX rose from 10/19/26 through 10/21/26, then fell 1.21% on 10/22/26. Could this mark the start of a decline lasting at least several weeks? Possibly, but the daily difference between NYSE 52-week new highs and 52-week new lows continues to signal bullishness.
The daily NYSE 52 – week new highs minus 52 – week lows ($MADN) chart courtesy of Barchart.com updates its action.
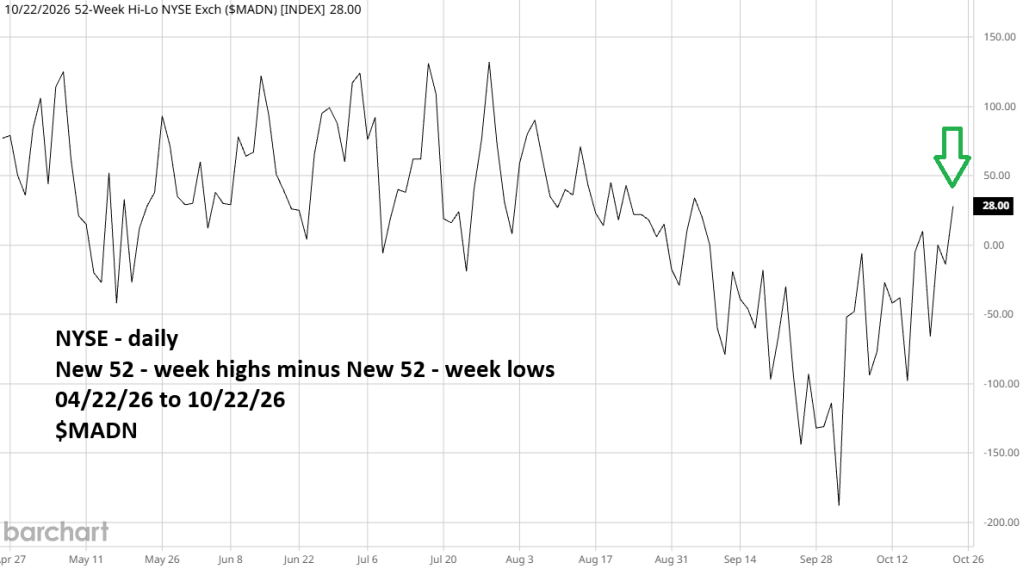
On 10/22/26 with the SPX down 1.21% $MADN went up and exceeded it 10/16/26 high implying at least a few more days of upside SPX action.
The 30 – minute SPX chart courtesy of Trading View shows what could be happening from an Elliott wave perspective.
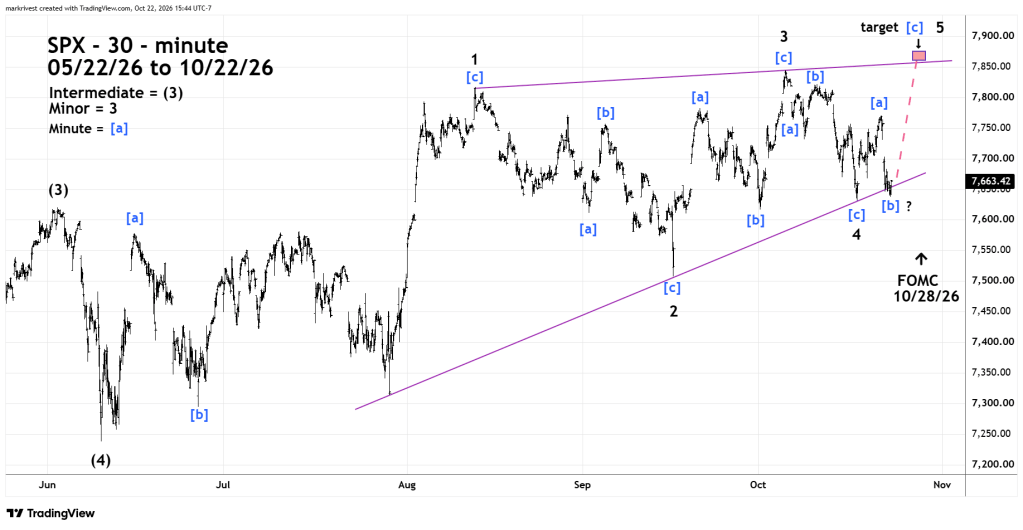
The 10/11/26 blog “Technology Stocks Relative Weakness – October 2026” illustrated that SPX since the 09/16/26 bottom may have been forming an Elliott wave – Ending Diagonal Triangle. However, the 10/14/26 to 10/16/26 decline invalidated that wave count.
It’s possible the movement after the action after 09/16/26 bottom may have been part of a larger Ending Diagonal Triangle from the 06/09/26 bottom. If so, SPX could be in the fifth and final wave of the pattern.
Sometimes FOMC interest rate announcements can trigger significant trend changes. The next FOMC announcement is 10/28/26.
The fifth wave of an Ending Diagonal Triangle typically extends briefly beyond the trendline connecting the endpoints of the first and third waves.
Its possible SPX could make an important peak in the 7,845 to 7,865 area on 10/28/26.

