U.S. stock market may have begun a multi-week decline. Short- term there could be a two or three trading day rally.
The SPX – 30 – minute chart courtesy of Trading View updates its intraday action.
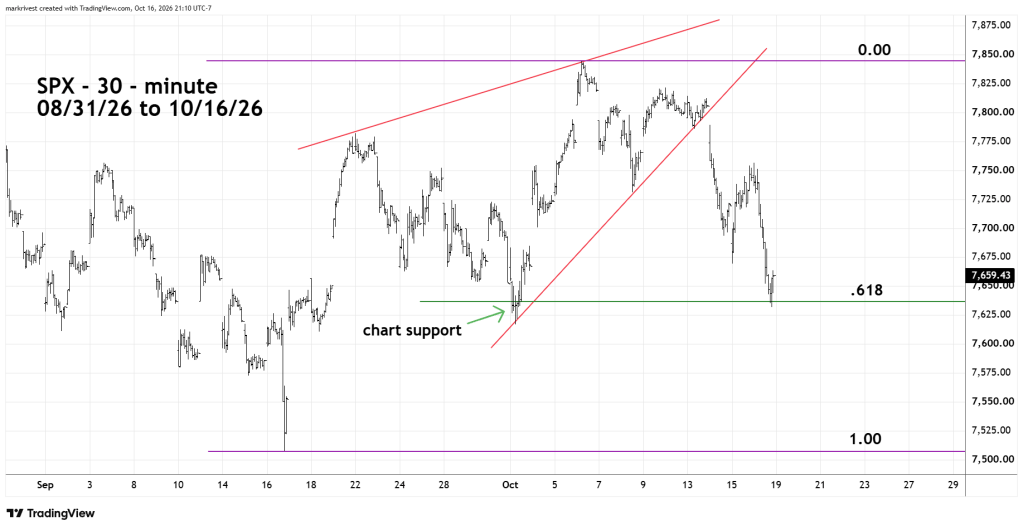
The 10/11/26 blog “Technology Stocks Relative Weakness – October 2026” illustrated that S&P 500 (SPX) may have been in a developing Elliott wave – Ending Diagonal Triangle. Subsequently SPX broke below the rising lower trendline – a bearish signal. What followed was a strong two trading day decline. Note where the decline ended on 10/15/26, just slightly below a Fibonacci .618 retrace of the 09/16/26 to 10/06/26 rally. The 10/16/26 bottom is also around 10/01/26 chart support.
Internal momentum implies at least a short-term bottom may have been made on 10/16/26.
The daily NYSE – 52 – week new highs minus 52 – week new lows ($MADN) chart courtesy of barchart.com illustrates what’s happening underneath the surface of price.
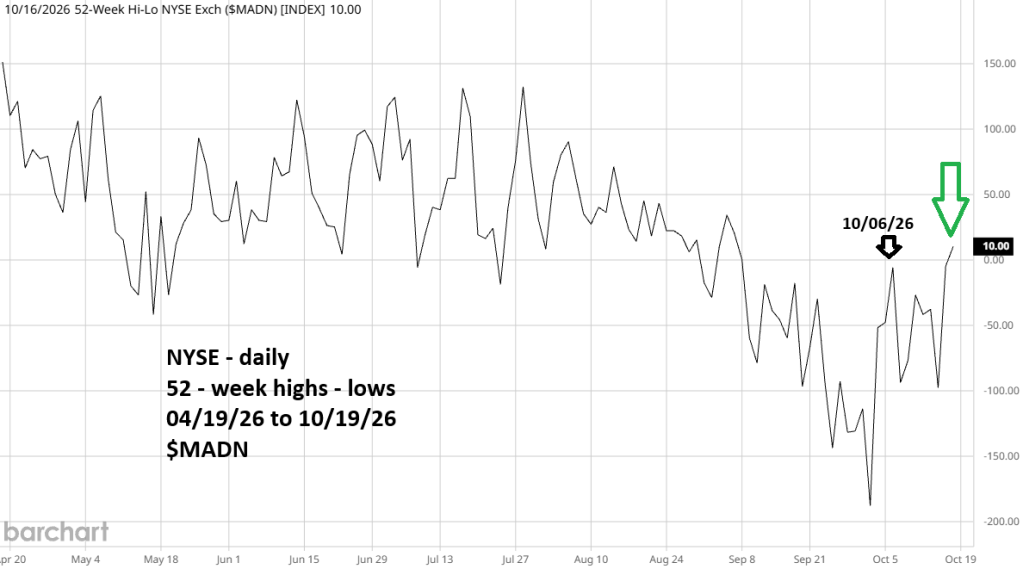
On 10/15/26 and 10/16/26 while SPX had significant declines, $MADN moved up. Additionally, note that $MADN has gone above the high it reached on 10/06/26 which was also when SPX reached its all-time high.
Important support level is SPX 10/01/26 bottom at 7,616.78. If on 10/19/26 SPX does not break below 7,616.78 there’s a good chance of a two to three trading day rally.

