On 07/23/26 S&P 500 (SPX) decline 1.20% if the decline is to continue there are two important support levels that need to be broken.
The first support level is illustrated in the daily SPX chart courtesy of Trading View.
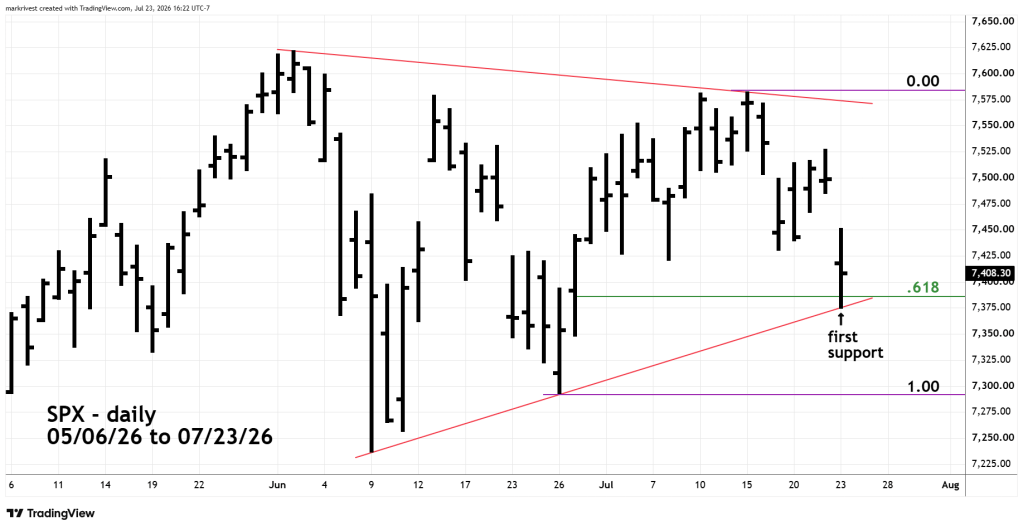
SPX on 07/23/26 went marginally below a Fibonacci .618 retrace of the 06/26/26 to 07/15/26 rally. It bottomed exactly at the rising trendline connecting the 06/09/26 and 06/26/26 bottoms.
The 06/18/26 blog “The Triangle of Death – Part Two” noted that a move below SPX 7,400 would make the continuation of a possible Elliott wave – Ending Diagonal Triangle doubtful. The SPX low on 07/23/26 was 7,376 making it unlikely that an Ending Diagonal Triangle is still under construction.
However, please note that the decline from 07/15/26 to 07/23/26 is a clean three – wave Elliott wave – Single Zigzag. This opens the possibility that an Elliott wave – Horizontal Triangle could be forming since the SPX all-time high made on 06/02/26. If so, SPX could make a new all-time high sometime in August 2026. A move below the SPX bottom on 07/23/26 at 7,376.00 shifts the probabilities in favor of the bears.
The S&P 500- StockCharts.com symbol $SPX shows a Point & Figure chart.
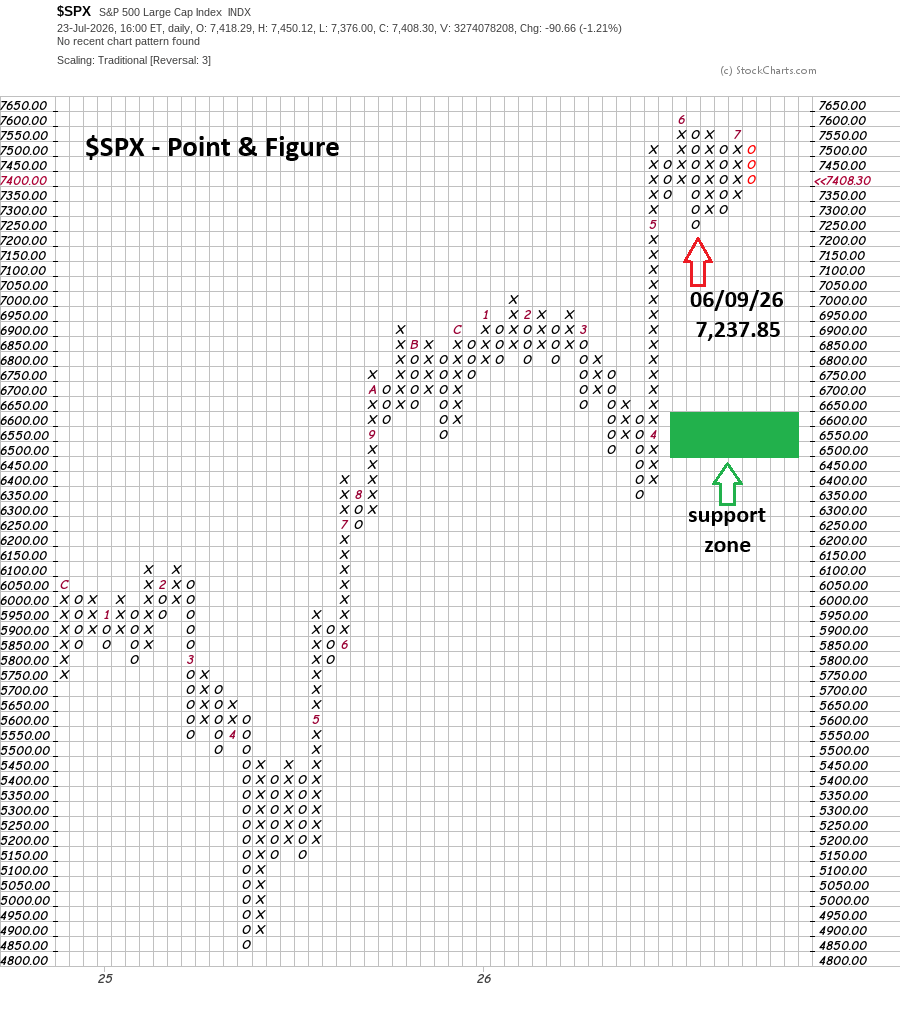
Point & Figure charts use columns of “X’s” and “O’s” symbols while ignoring the passage of time. It is designed to strip away minor day-to-day market noise so traders can clearly identify major trends, breakouts, and support and resistance zones.
The most important level on this chart is the bottom made on 06/09/26 at 7,237.85. Note that a break below this bottom opens the door for a move to the next support cluster in the 6,650 to 6,500 area.
The 07/19/26 blog “Amazing Lunar Cycles – May to July 2026” noted the next New Moon on 07/29/26 could signal an S&P 500 bottom. If within the next few trading days, there’s a move below 7,237.85 it could trigger a one- or two-day mini crash down to 6,500.
This is a low probability scenario, yet it can’t be ignored given there is very little chart support below 7,237.85.

