S&P 500 (SPX) Elliott wave count since 06/02/26 could be the beginning of a bear market.
The SPX – 30 – minute chart courtesy of Trading View updates the chart illustrated in the 06/11/26 blog “S&P 500 – Short Term Elliott Wave Count – 06/11/26”
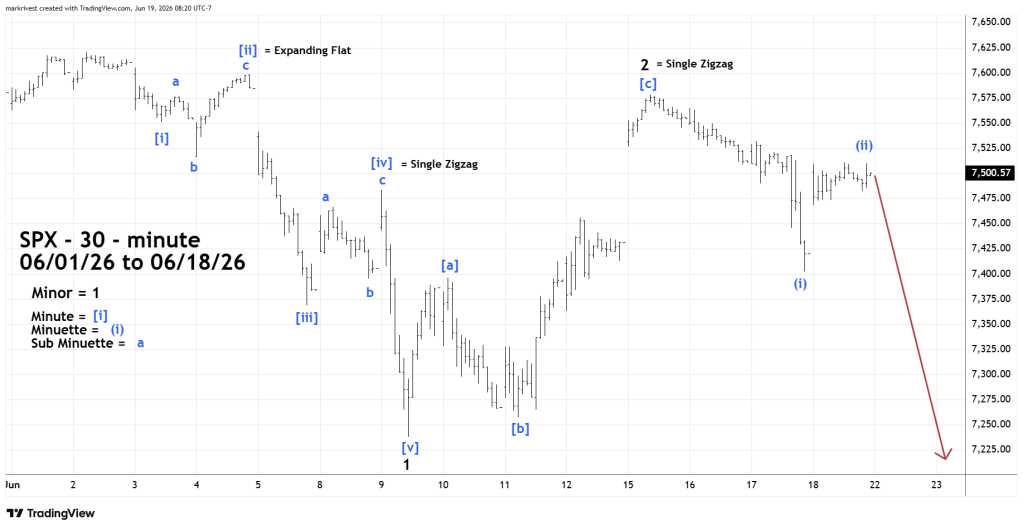
The presumed five waves down from 06/02/26 to 06/09/26 could be the first part of a larger developing five waves down. Please note within the presumed Minor wave “1” there’s alternation between the second and fourth waves of the five waves down.
Minute wave [ii] is an Elliott wave – Expanding Flat.
Minute wave [iv] is an Elliott wave – Single Zigzag.
The 06/11/26 blog speculated that the post 06/09/26 rally could terminate near the SPX 7,475 area. The rally ended at SPX 7,577.
The SPX – 5 – minute chart zooms in on the action after the 06/15/26 peak.
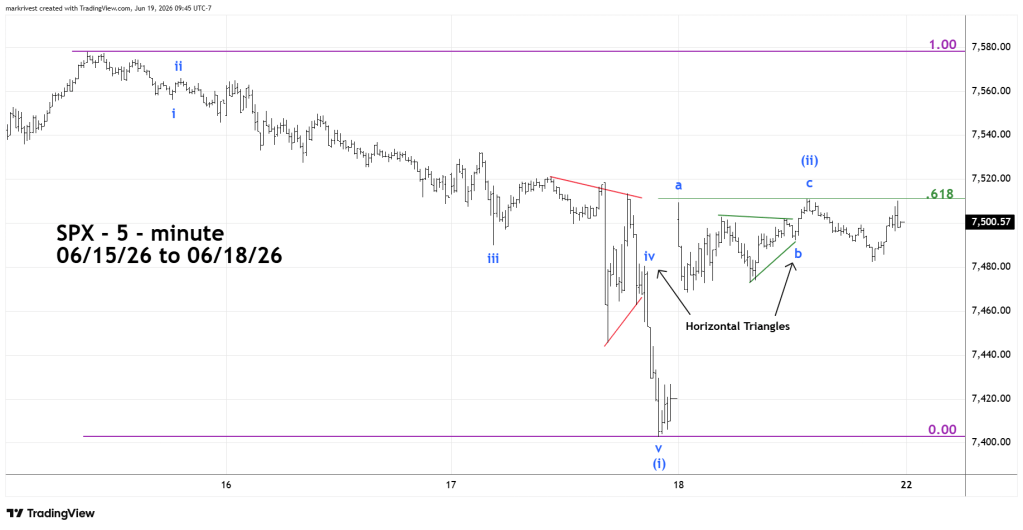
The 06/15/26 to 06/17/26 decline has a less clear Elliott count than the 06/02/26 to 06/09/26 drop. The difficulty comes from the presumed Sub Minuette wave “iv” which appears to be a wide Elliott wave – Horizontal Triangle.
There are two clues in the post 06/17/26 rally that imply it’s a correction of the 06/15/26 to 06/17/26 decline.
Please note that the peak on 06/18/26 was exactly at a Fibonacci .618 retracement of the 06/15/26 to 06/17/26 decline.
The second clue is the mid – portion of the post 06/17/26 rally which counts best as an Elliott wave – Horizontal Triangle. This structure only appears in the fourth wave position of Elliott – motive waves, and in the “b” wave position of corrective waves.
This structure cannot count as a fourth wave; probabilities favor the Horizontal Triangle wave count.
SPX action on 06/22/26 could be very important. If SPX ends the session below the 06/18/26 session close, it could be the start of a much larger decline.
