This website prior blog had noted Gold in U.S. dollars could reach Fibonacci resistance at 4,363.52. Today 06/15/26 Gold’s high was 4,369.48.
The four – hour Gold chart courtesy of Trading View updates the action.
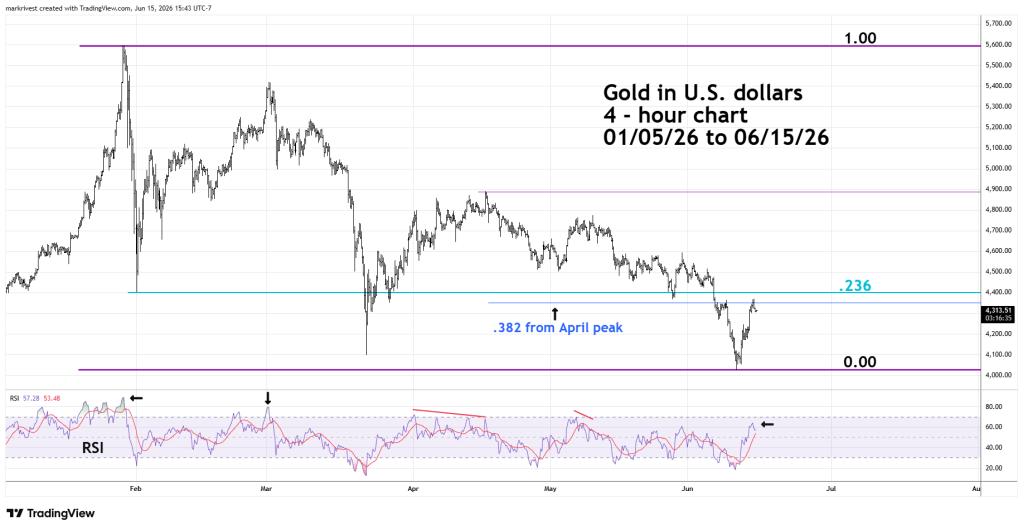
When using Fibonacci analysis two or more Fibonacci coordinates increase the chances of a potential support/resistance zone. The 06/14/26 blog illustrated Gold’s April 2026 to June decline to find the first potential Fibonacci resistance point.
This was a Fibonacci .382 retracement of the April to June decline. Zooming out to the larger decline which began in January 2026 reveals another Fibonacci coordinate at approximately 4,400.00. This is a Fibonacci .236 retracement of the entire bear phase since January 2026.
The price peaks on January and March had four – hour RSI readings deep in the overbought zone which starts at 70.00. The April and May price tops came with RSI bearish divergences. At the 06/15/26 peak RSI was not in the overbought zone and did not have a bearish divergence. This condition implies Gold rising above 4.369.48.
If within the next few days Gold reaches the 4,400 area watch the four – hour RSI.
If RSI is in the overbought zone and/or has a bearish divergence, an important peak could be developing.
