The cease fire in the Iran war triggered a stock buying panic. Elliott wave and Point & Figure analysis indicate the next potential resistance area.
The daily S&P 500 chart – StockCharts.com symbol $SPX illustrates daily momentum.
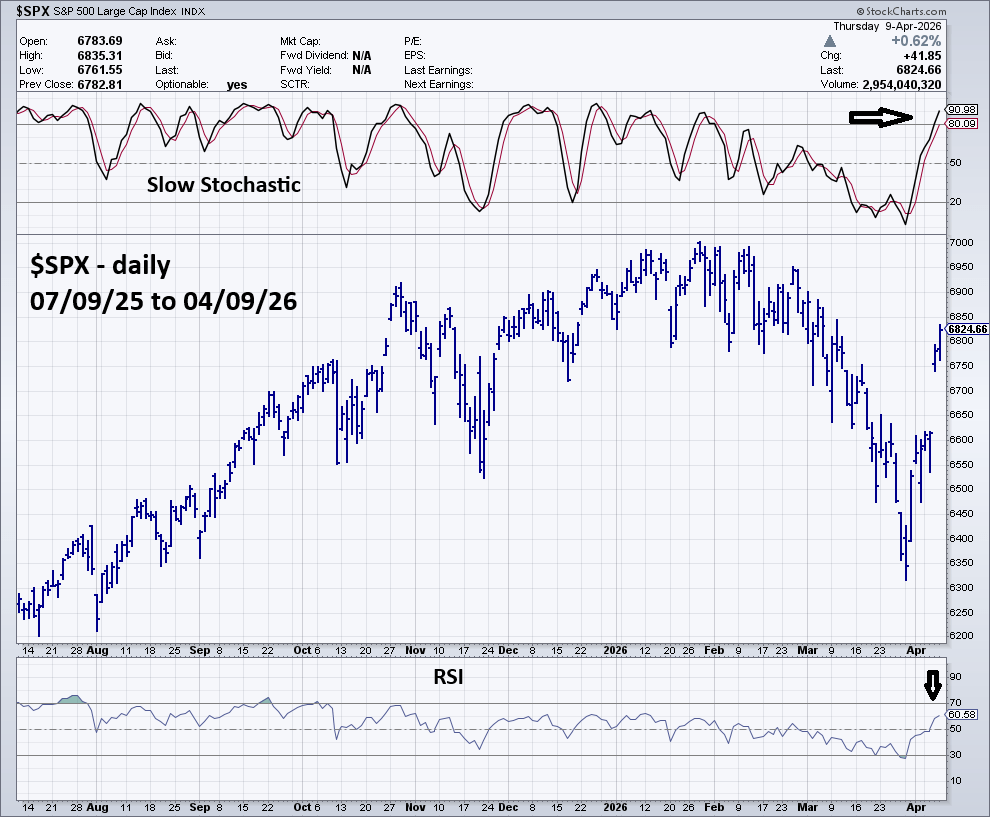
Both lines of Slow Stochastic have reached the overbought zone which begins at 80.00. This implies a peak could come in a few trading days.
Daily RSI is at 60.00, its overbought zone begins at 70.00. This reading also implies a few more days of upside action.
The 30 – minute SPX chart – Trading View symbol (SPX) shows a possible Elliott wave count.
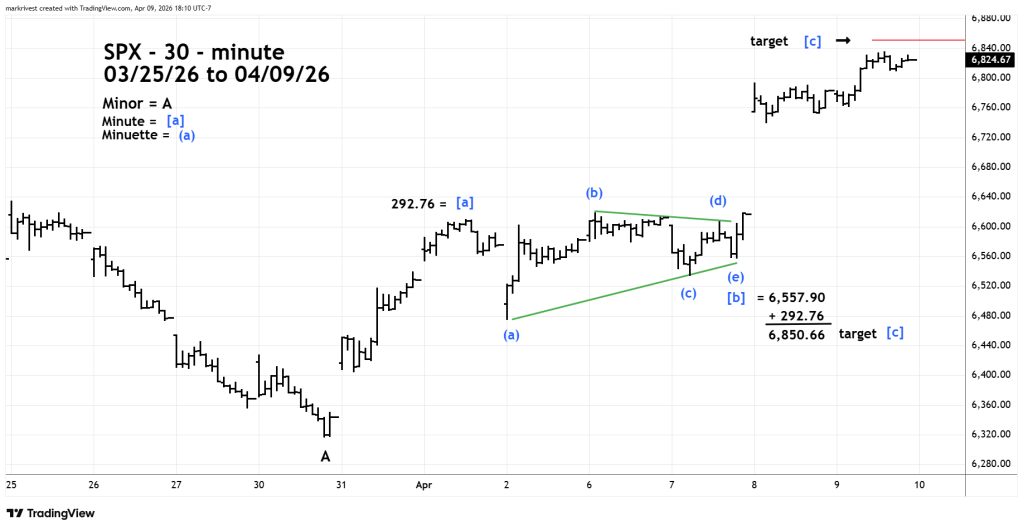
After the first part of the rally labeled Minute wave [a] the SPX went into a sideways move that appears to be an Elliott wave – Horizontal Triangle. These are corrections of the main trend that appear only in the “B” wave positions of Zigzag patterns and in the fourth wave of motive patterns. The position of this presumed Horizontal Triangle looks like its wave [b] of a developing Zigzag.
Within Zigzag patterns a common Fibonacci relationship is that wave “A” is equal in price to wave “C”. In this case Minute wave [c] begins at the termination point of the Horizontal Triangle. The end point of the Horizontal Triangle is 6,557.90, adding the length of Minute wave [a] of 292.76 targets 6,850.66 as the termination point for Minute wave [c].
The StockCharts.com chart shows the next potential resistance zone.
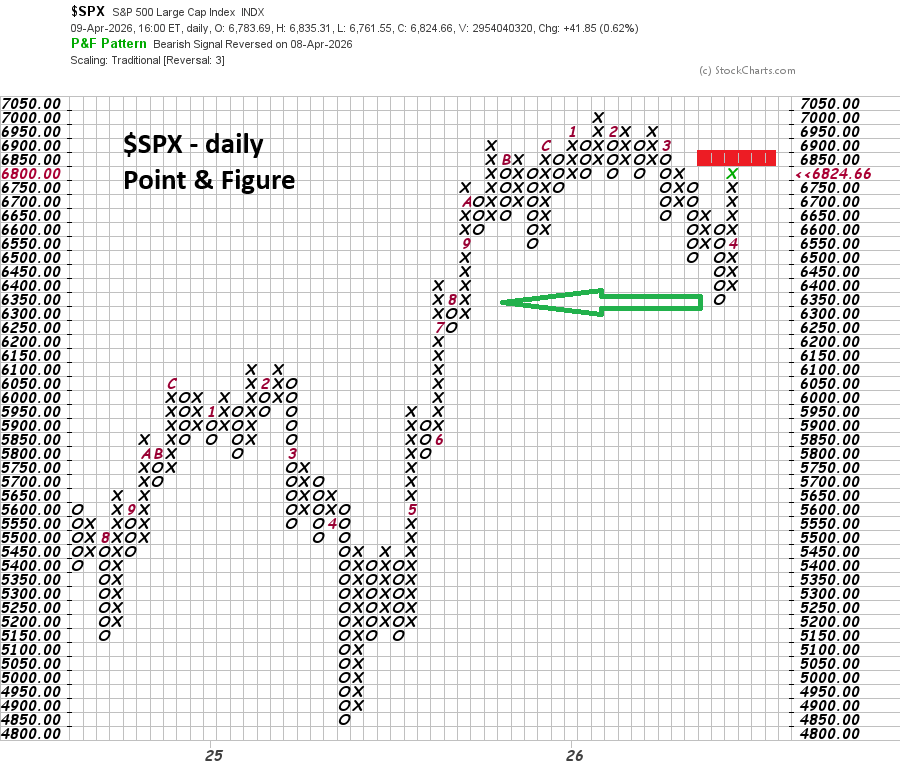
Point & Figure charts are a great tool to discover potential support/resistance areas.
Point and figure charts focus on price movements and trends without time consideration, using X’s for rising prices and O’s for falling prices.
The wider the row of X’s and O’s, the greater potential support/resistance.
Note that the recent bottom came at a row of three.
Just above the current $SPX level is a row of ten X’s and O’s in the 6,850 to 6,900 area. This is potentially very strong resistance.
In the next few trading days SPX could peak in the 6,850 to 6,900 area.
