The 03/26/26 blog “Resistance at the 200 – Day Moving Average – March 2026” illustrated what happed when the S&P 500 (SPX) marginally moved above the 200 – Day Simple Moving Average (SMA). Subsequently the SPX continued to decline.
The SPX as of 04/02/26 was about one or two trading days from the 200 – day SMA. Could this line again be resistant?
The daily SPX chart courtesy of Trading View updates the action.
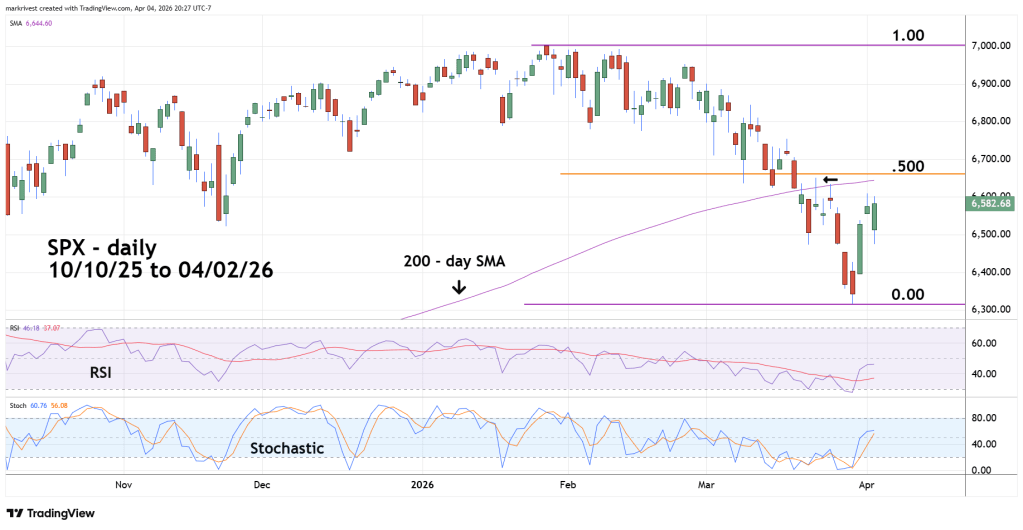
The 200-day SMA is also near a Fibonacci .500 retracement of the January to March decline.
Both daily RSI and Stochastic are in the neutral zone implying more upside action.
The biggest factor is the Iran war. Tuesday 04/07/26 is the deadline for a proposed peace deal. If there’s peace, it’s likely to trigger a huge rally for stocks. Continued fighting could cause panic selling.
