Two indicators suggest Crude Oil could continue to rise.
The Crude Oil daily Continuous Futures chart (CL2!) courtesy of Trading View shows what happened in 2022.
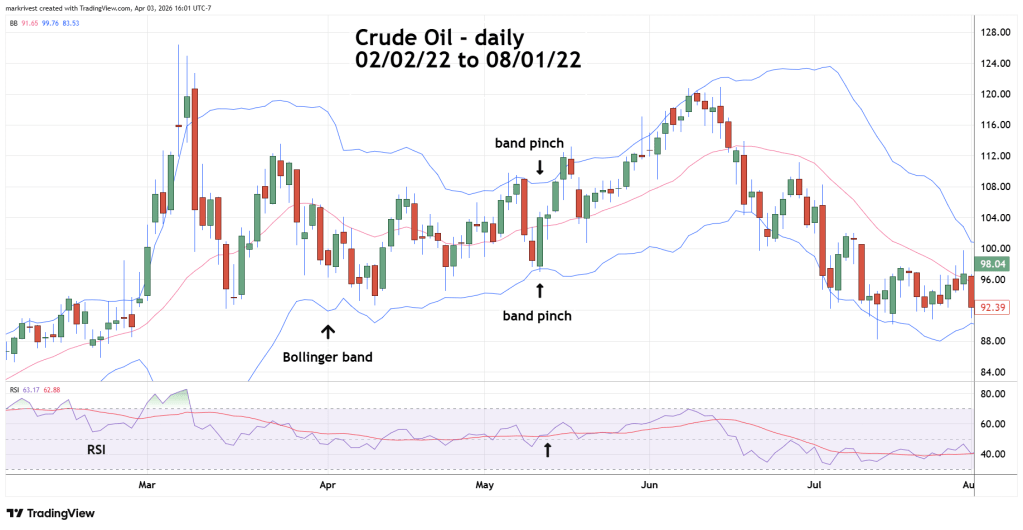
In March 2022 Crude Oil made a primary peak. After several weeks of sideways action the Bollinger bands contracted, at the narrowest point daily RSI moved above its moving average line. This action signaled a rally to a secondary peak in June 2022.
The recent action of Crude Oil looks like what happened in 2022.
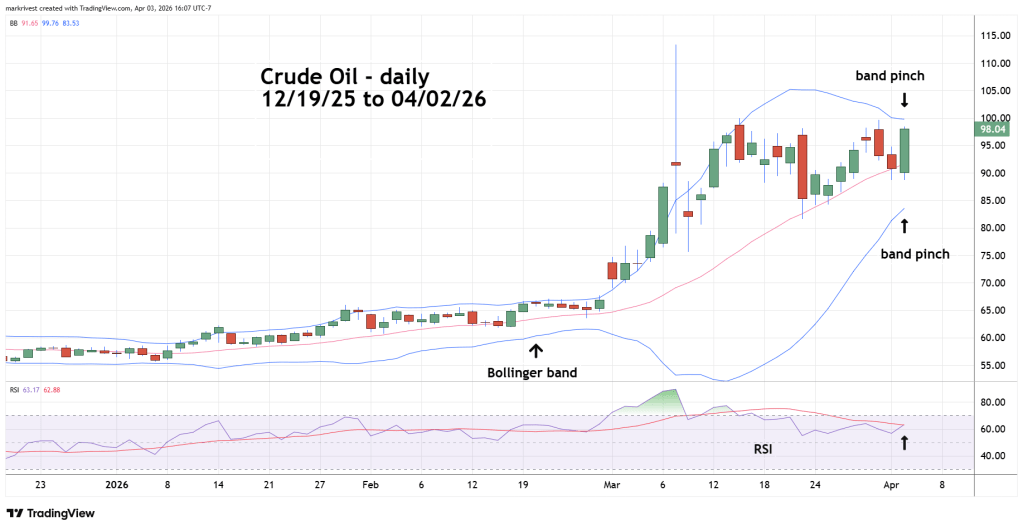
Crude Oil made a peak on 03/09/26 and has since been a sideways trend. Bollinger bands have again narrowed, and on 04/02/26 daily RSI has moved above its moving average line.
This action suggests at least a short-term move higher and possibly above the 03/09/26 peak.
The factor that could change this forecast is an end to the war with Iran.
