The 03/14/26 blog “Update U.S. 30 – Year Treasury Yield – Elliott Wave Count – 03/13/26” illustrated that the U.S. 30 – Year Treasury Yield (TYX) had probably completed a multi- year Elliott wave – Horizontal Triangle.
The weekly TYX chart courtesy of Trading View updates the action.
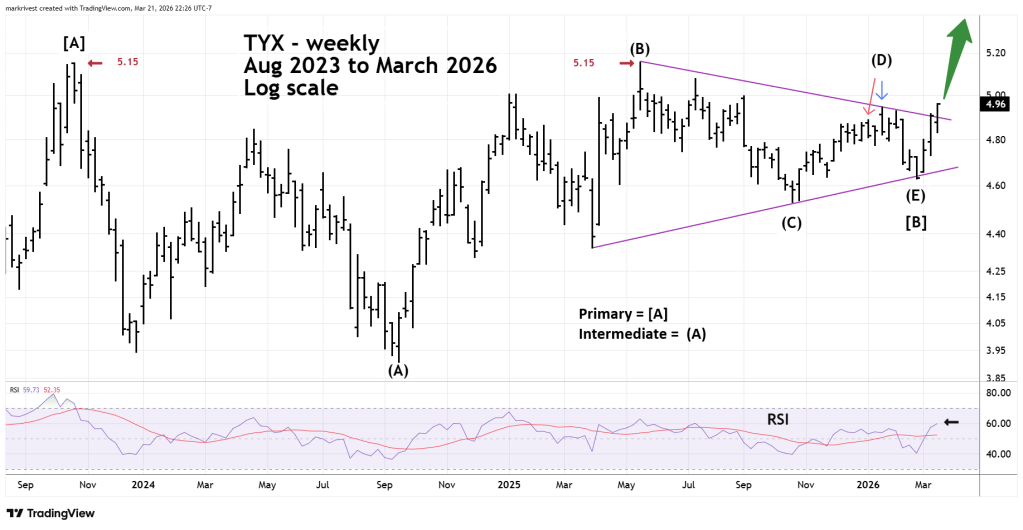
During the week of 03/16/26 to 03/20/26 an important upside breakout occurred.
Note that from an Elliott wave perspective that based on the internal wave structure of the presumed Intermediate wave ( E ) there are two ways to identify the peak of the presumed Intermediate wave ( D ). Either the 01/05/26 or the 01/20/26 peak.
From the perspective of standard Technical analysis, the important point is the peak made during the week of 01/20/26 at 4.95. The move above this secondary top also broke the multi-month declining trendline from the May 2025 primary peak.
TYX could very soon be at the multi-year double peak at 5.15. Triple peaks are rare, a move above 5.15 could trigger a rally to at least 6.00.
Evidence from the weekly RSI supports the theory of a bull trend. The most recent weekly RSI reading is 59.73, the overbought zone begins at 70.00.
In the next few weeks TYX could be above 5.15.
