February 6, 2026, was a historic day the Dow Jones Industrial Average (DJI) made a new all-time and reached 50,000. What could also be historic is a potential Elliott wave pattern and possible Fibonacci resistance level.
First an update on internal U.S. stock market momentum. The prior blog “February Downside Rollover – 02/05/26” noted that both the NYSE and S&P 500 – Advance/Decline lines made new all-time highs. On 02/06/26 both these indicators again made new highs.
The NYSE cumulative A/D line ($NYAD) Courtesy of StockCharts.com is illustrated below.
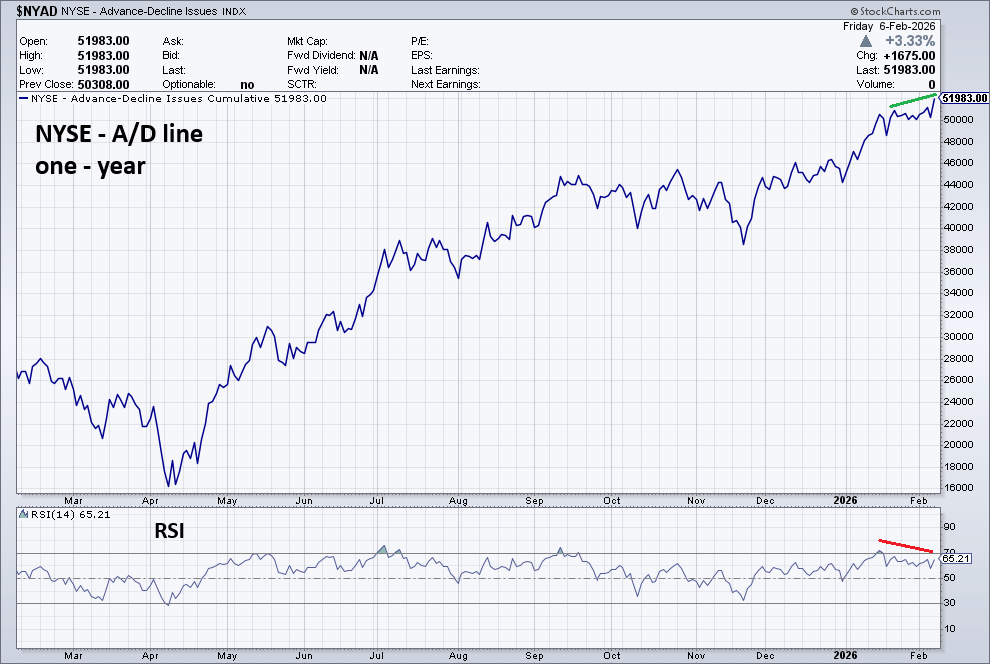
This is bullish for U.S. stocks. Significant U.S stock tops usually come after NYSE and S&P 500 – A/D line peaks. Please note that in the short – term the NYSE – A/D line had an RSI bearish divergence.
What happened with the DJI on 02/06/26 is fascinating and potentially bearish.
The 11/01/25 blog “Bullish Pieces of an Elliott Wave Puzzle” illustrated that there was an Inverse Fibonacci relationship with the S&P 500 – February to April 2025 decline. The length of the two month drop multiplied by the Fibonacci Inverse ratio of 1.618 targeted S&P 500 – 6,958.48 as a potential resistance level. The S&P 500 – all-time high made on 01/28/26 at 7,002.28 was within leeway of the bullseye Fibonacci level.
The daily DJI chart courtesy of Trading View examines its action since late 2024.
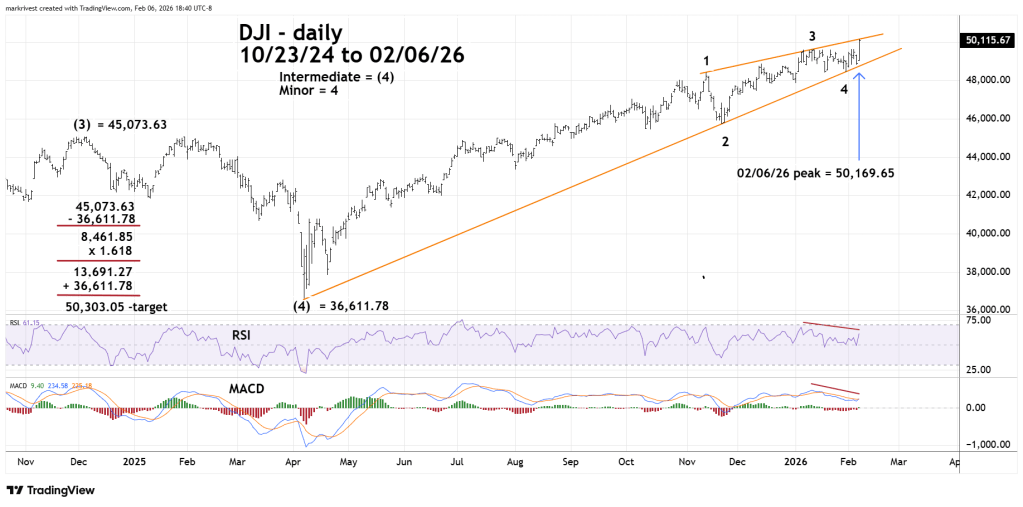
Using the same S&P 500 – Fibonacci calculation targets DJI – 50,303.05 as potential resistance. The high on 02/06/26 was 50,169.65 within leeway of the bullseye level.
The 01/30/26 blog “Colossal Ending Diagonal Triangle – 01/30/26” speculated that the S&P 500 may have been forming a giant Elliott wave – Ending Diagonal Triangle since the April 2025 bottom.
The same phenomenon could be happening with the DJI. Please note that both the daily RSI and MACD have bearish divergences hinting at a decline.
The hourly DJI chart zooms in on the intraday action.
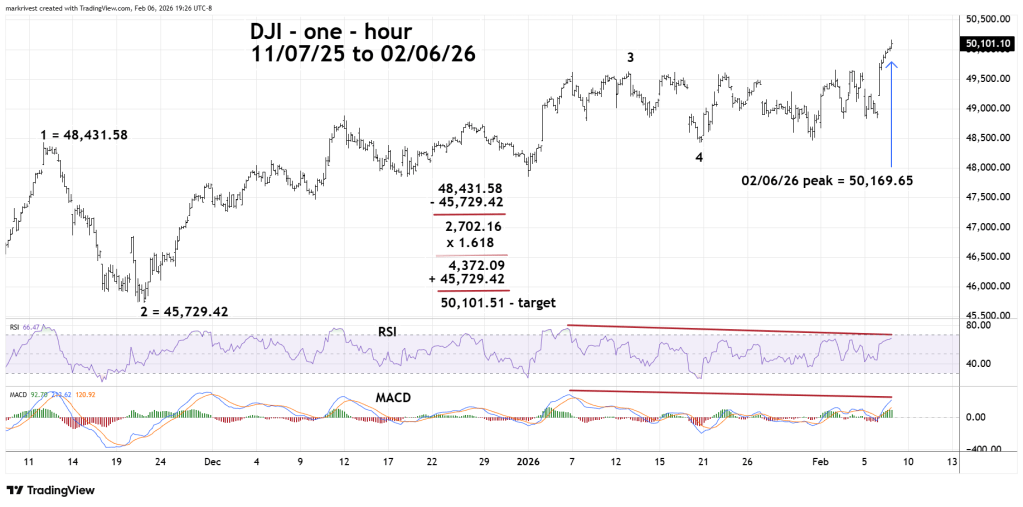
Using the same Fibonacci calculation with the November 2025 decline reveals a secondary Fibonacci resistance coordinate. The level of 50,101.51 is close to the primary Fibonacci coordinate of 50,303.05. The dual Fibonacci points represent potentially powerful resistance.
On 02/06/26 the NYSE Composite index and the Dow Jones Transportation Average also made new all-time highs. These are bullish indicators. The next blog will focus on what did not make new all-time highs
