The 11/28/25 blog “December 4, 2025, an S&P 500 Peak?” noted that lunar cycles and momentum evidence implied the S&P 500 (SPX) could make an important top on 12/04/25. Elliott wave patterns and momentum hint that the SPX high on 12/05/25 may be the first peak in a developing multi month bear market.
The daily SPX chart courtesy of Trading View updates its recent action.
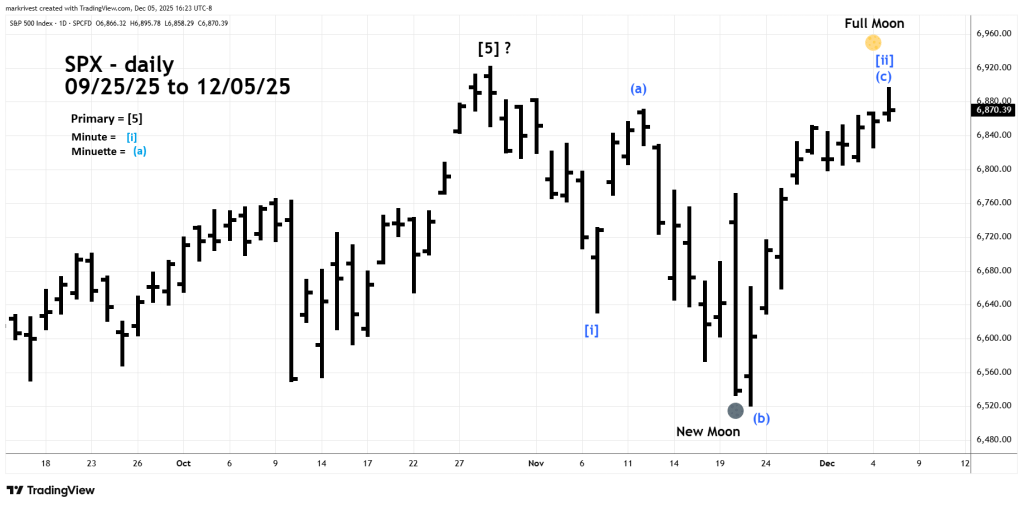
Markets can sometimes turn on Full or New Moons plus or minus two trading days. The New Moon on 11/20/25 signaled a possible bottom, which occurred on 11/21/25. The 11/28/25 blog noted the Full Moon on 12/04/25 could signal an SPX peak.
The 11/28/25 blog also noted major SPX – Fibonacci resistance at 6,958.48, a new all-time high. On 12/05/25 SPX failed to exceed the all-time high made on 10/29/25 at 6,920.34.
There are always alternate Elliott wave counts. It’s possible the on 12/05/25 SPX completed an Elliott wave – Inverse Expanding Flat correction. This movement corrects the progress of a down trend and is composed of three sub waves.
The initial move of the correction, in this case Minuette wave (a) is followed by a reversal which exceeds the wave (a) point of origin. The final wave Minuette wave (c) ends beyond the termination point of wave (a).
If this wave count is correct, it’s probably the first correction of a bear move that could continue for several months.
The daily StockCharts.com – S&P 500 ($SPX) chart illustrates momentum.
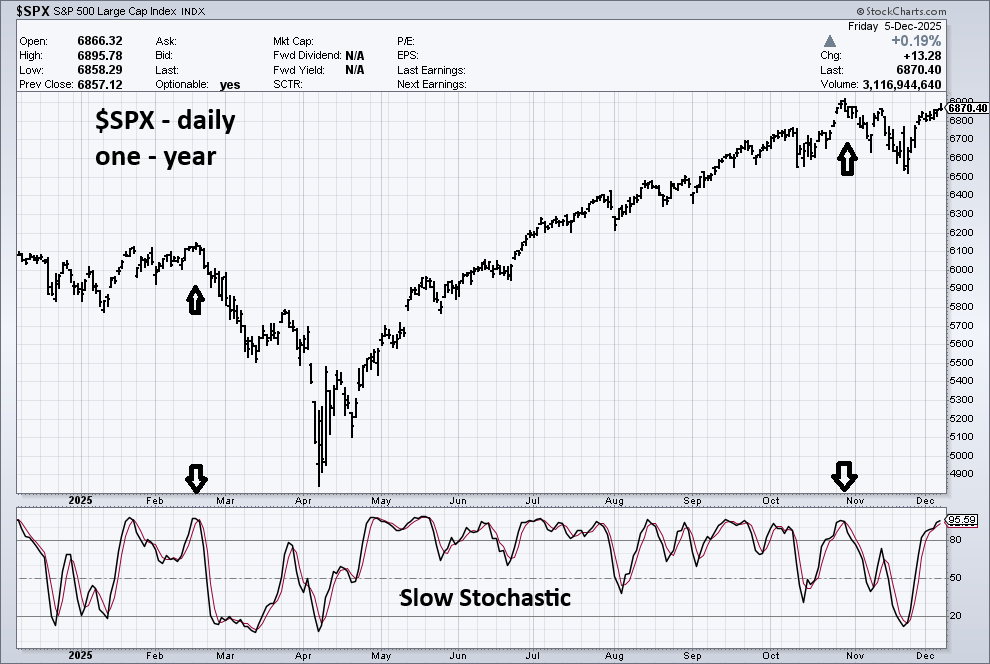
On 12/05/25 Slow Stochastic was deep into the overbought zone which begins at 80.00. Note that it’s now at the same level as the $SPX short-term top on 10/29/25 and the significant peak made in February 2025. The daily Slow Stochastic can stay in the overbought zone for several weeks. If Slow Stochastic does not go below 80.00 in the next few trading days, $SPX could rally into the end of December 2025.
