The 09/13/25 blog “S&P 500 at 6,666?” noted the S&P 500 (SPX) hit 6,600 which was the bull’s eye of a Fibonacci price relationship with the SPX bull market in August 1987.
Also noted was that the main U.S. stock indices rarely turn on round numbers. The SPX made a major bottom in March 2009 at 666, and perhaps the SPX could peak at 6,666.
The daily SPX chart courtesy of Trading View updates its action.
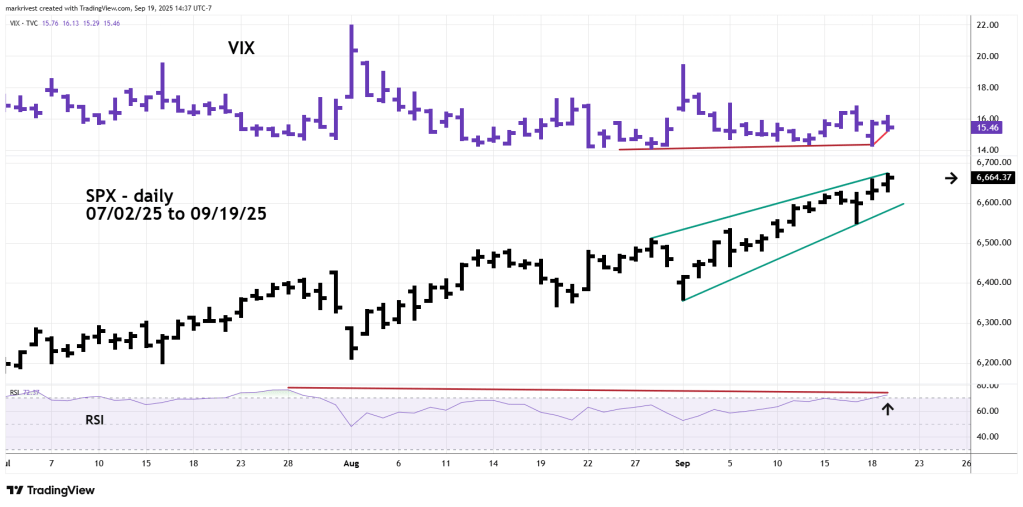
The SPX high on 09/19/25 was 6,671 and ended the session at 6,664.
All the major SPX peaks since March of 2000 have occurred with the VIX rising from its primary bottom. VIX has now made two higher bottoms since its primary low on 08/28/25.
Daily RSI has reached the overbought zone above 70.00 and has a bearish divergence vs. its maximum level reached on 07/28/25.
One important bullish factor; on 09/19/25 all three main U.S. stock indices made new all-time highs.
During the week of 09/22/25 to 09/26/25 watch for only one of the main U.S. stock indices, S&P 500, Nasdaq Composite or Dow Jones Industrial Average making an all-time high.
